Journal Name: Scholar Journal of Applied Sciences and Research
Article Type: Research
Received date: 06 July, 2018
Accepted date: 27 July, 2018
Published date: 09 August, 2018
Citation: Al-Hatali A, Soosaimanickam A (2018) A Comparative Study of the Efficient Data Mining Algorithm to find the most influenced factor on price variation in Oman Fish Markets. Sch J Appl Sci Res. Vol: 1, Issu: 5 (10-18).
Copyright: © 2018 Al-Hatali A, et al. This is an openaccess article distributed under the terms of the Creative Commons Attribution License, which permits unrestricted use, distribution, and reproduction in any medium, provided the original author and source are credited.
Abstract
Fishing is considered as one of the oldest Omani professions that contributes to the national economy and job creation, particularly; where many people, depend entirely on it as a source of income and living. The customers nowadays need a good application to assist them to overcome the issue of rising of fish prices. This study aims to help to predicate reason behind increasing prices in Oman fish markets using data mining algorithms, by means of studying the history of data that will assist to make a proper decision. The study considered the fish markets in Sultanate of Oman where it selected 29 markets and 15 fish species in each market. In addition, the data mining algorithms, namely J48 algorithm, Decision Stump, and Random Tree has been applied to classify data to find the most affected factor in fish prices. The suitable algorithm, which provides good performance, has been chosen for developing an application. This application model will help customers to find different details about prices in Oman fish markets.
Keywords
Oman fish market, Factor analyses, Attribute selection, Information gain, Weka software, and Classification algorithm.
Introduction
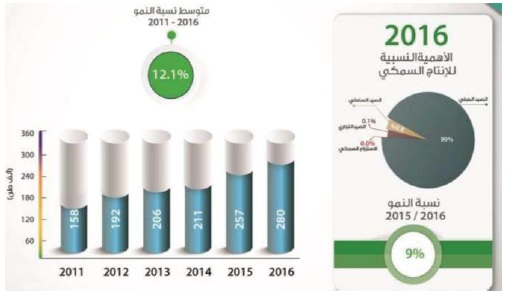
Oman fisheries have grown dramatically in the last 47 years. In 2006, fisheries output is reported to have risen to 280,000 tones [1]. This shows that fisheries sector continues to grow more rapidly than any other animal food producing sectors. The average growth between 2011 and 2016 is about 12.1% [2]. Demand for fisheries products continues to increase to meet the needs of consumers, reflecting recognition of the dietary benefits of fish and shellfish in both developed and developing countries.
There is a variation in the fish prices in the market that make Omani customers suffer from changing fish prices. An analytical study will make to choose the most affected factor that has an impact on fish price. Weka Software has been used to classify and evaluate the factors related to this study. Data mining is a group of methods to extract hidden and useful information from large databases of various business domains. For identifying the interesting patterns and correlation and to get benefits from the data warehouse, Factor Analysis and Information Gain methods are used [3]. Factor analysis reveals interesting associations and/or correlation relationships among a large set of data items. Factor Analysis shows attributes value conditions that occur frequently together in a given dataset [4].
The data that is stored in the Agriculture and fisheries databases show an increase in prices often, there is a need to take advantage of this data by applying data mining techniques such as Factor analysis, Information Gain, and others (Figure 1).
Figure 1: Total Fish Production 2011 – 2016 [4].
The discovered knowledge can be used to classify and analyze fish attributes, and to find the relationship between factors that affect fish’ price and shows variation. The purpose of this study is to apply a classification (analysis) model for data and make a comparison based on the accuracy of data for different classifying algorithms and then find information gain of three experiments and understand entropy concept in order to develop an application that could reduce the issue of raising the prices.
Fish Market in Sultanate of Oman
The Oman government has been working on improving food security and production which is driven by investments in agriculture, horticulture, aquaculture and sea fishing as the country looks for sustainable solutions to support a growing population and boost exports. In fisheries alone, the government aims to raise production from 257,172 tons a year in 2015 to 480,000 tons by 2020. Omani consumers are experiencing not only a shortage of fish in the Sultanate’s markets but also rising prices. Oman is a large consumer of fish at around 28 kg per person per year). Fish prices have been rising due to a growing population and demand from neighboring countries and tourist facilities.
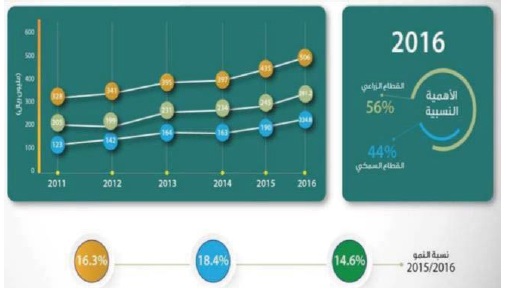
Fishing is considered as one of the oldest Omani professions that contributes to the national economy and job creation, particularly; where many people, depend entirely on it as a source of income and living [5,6]. It is clear that there are significant improvements made in this area, where the average growth rate from 2011 to 2016 has grown by 12.1%; where it increased to 280 thousand tonnes in 2016 compared to 158 thousand tonnes in 2011 as it is shown in Figure 2 [2]. Further, it is considered as one of the significant economic sectors that contribute effectively to the growth of GDP. According to NCSIO in 2016, the total GDP of fisheries increased by 18.4% compared to 2015 as it is illustrated in Figure 2 [2].
Figure 2: Gross Domestic Product Value of the Agricultural and Fisheries Sector [4].
Furthermore, the social aspect has an important impact on the fisheries sector, where a large segment of the citizens and residents depend on it, and daily fluctuation in prices has a direct influence on them. Evidently, there are different fish prices for the same species in different locations at the same time. The reasons can be attributed to several factors affecting the fish prices, for example, supply and demand, climate, oil, fuel, gas, and others more [7,8].
Literature Review
Nowadays, the research community has given more attention to the topics that is related to analyzing factors, so the reason could be attributed to the active contribution in the growth of economies in governments and institutions. There are different approaches used to study the factor (feature analyses), some of the research papers are highlighted here.
The research paper in reference [9] focuses on the economic field, where it used factor analysis Models: Classification Tree (CART). The data were collected in 20 countries and the result shows the economic rank of countries (Kuwait, Germany, Iceland, Belgium, Denmark, Taiwan, Qatar, Ireland, Sweden, Luxemburg, Austria, Singapore, Norway, Netherland, Hong Kong, Brunei, us, Switzerland, Canada, and Australia). There are five papers that come under the fisheries and agriculture, where they used different data mining algorithms for factor analysis. According to T SaiSujana [10], a comparison study of nine different data sets having binary and multiple imbalanced classes and correlated with other metaheuristic algorithms. The results show that the proposed approach is providing high classification accuracy with features subset having fewer features. They compare those models based on symmetric error statistics, such as Root Mean Square Error (RMSE), Mean Absolute Error (MAE) and Mean Absolute Percent Error (MAPE), where the better the algorithm performance is produced, the smaller error.
In the finance area, different algorithms have been used for feature selection, for instance [11], presented a comparative study among Classification Model. The authors used information about vehicle services performed and vehicle sales at over 200 auto dealerships. He concluded that Decision tree model provides better results than other model, in particular, the values of RMSE, MAPE and MAE.
In agriculture area, different algorithms have been used for factor analysis, for instance [12], examined the factors influencing the development of nanotechnology in the agricultural sector of Iran. The methodology used in this study involved a combination of descriptive and quantitative research and included is the use of factor and descriptive analysis as data processing methods. The research population includes researchers in the field of nanotechnology in the West Azarbaijan Province (N=74). The data collected by interviewing the respondents and analyzed by using factor analysis technique. Based on the perception of the respondents, about 50% of the total common variance is explained by research, educational and informative factors, where the majority of it has been explained by the research factor (19.43%).
The results show that bagging provides a significant improvement in reducing the errors, and it concluded Decision Tree models give better results than other models.
Methodology
Many customers and suppliers face many issues with regard to varying price fluctuations in the fish markets without knowing the reasons or factors that affects the pricing. In the meantime, they are looking to find a solution among the proposed approaches, which is likely to find most effected factor on fish price to avoid any losses and to fulfill their needs as much as possible.
The important endeavor in this research is to conduct a comparative analysis for the commonly used models in data mining classification algorithms. The well- performed data mining algorithm will be chosen to build an application.
Proposed Application Model
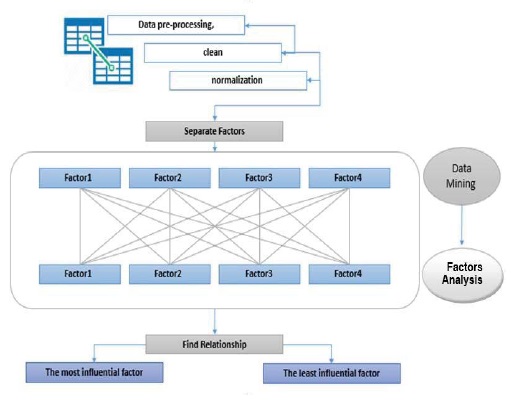
The main idea of this model is to build an application that will help the customer to reduce the problem of rising prices as much as possible. As well as measuring the efficiency of these data mining algorithms in order to choose the best algorithm to build the proposed application. As indicated in Figure 3, there are five main phases, which are data collection, data preprocessing, classification process, evaluation and analysis, and finally developing the application. First, the data has been collected manually from 29 markets all over Oman during the period of November 2015 to October 2016, with prices of 15 fish species. Second, in the data preprocessing, data cleaning is done to organize the data to be used in the classification process. Third, the Weka classifier is used to perform the classification process. Fourth, in the evaluation process, an analytical study has been conducted based on the outcomes of RMSE (Root Mean Square Error) on the used models, which are the J48 algorithm, Decision Stump, and Random Tree. Finally, the well- performed the algorithm, which has less RMSE has been selected to develop the application.
Figure 3: Proposed Model.
Tool Used (Weka Software)
For this study, Weka (Waikato Environment for Knowledge Analysis) software is chosen for the implementation. Weka is a popular suite of machine learning software written in Java, developed at the University of Waikato, New Zealand. Weka is free software available under the GNU General Public License [13]. Weka is collection of machine learning algorithms (Classification, Clustering and Regression) which can be directly applied to the data. Weka GUI Chooser consists from different applications such as Explorer, Experimenter, Knowledge Flow, Workbench and Simple CLI.
The reason why WEKA is chosen for the experiments is that the Factor Analysis or feature selection algorithms and especially information gain are almost identically implemented when compared with the original algorithms. These implementations exist under the classification and regression capabilities of the tool. For the purpose of study, Weka 3.8 is used as indicated in the following Figure 4.
Figure 4: Weka GUI Chooser.
Classification Algorithm
There are different classification algorithms in Weka software tool. Here in this section brief details and comparison between three algorithms and which one has high accuracy and fewer errors than the other algorithms. The chosen algorithms are J48, Random tree, and Decision Stump: The J48 algorithm: it is a predictive machinelearning model which decide the target value of a new sample based on different attribute values of the available data is J48 decision tree [14]. J48 is an extension of ID3. The additional features of J48 are accounting for missing values, decision trees pruning, continuous attribute value ranges, derivation of rules, etc. In the WEKA data mining tool, J48 is an open source Java implementation of the C4.5 algorithms. The WEKA tool provides a number of options associated with tree pruning. The different attributes denoted by the internal nodes of a decision tree, the branches between the nodes tells us the possible values that these attributes can have in the experimental results, while the terminal nodes tell us the final value of the dependent variable. This algorithm generates the rules from which particular identity of that data is generated. The objective is progressively generalization of a decision tree until it gains equilibrium of flexibility and accuracy.
Random Tree is a supervised Classifier; it is an ensemble learning algorithm that generates lots of individual learners. It employs a bagging idea to construct a random set of data for constructing a decision tree. In standard tree every node is split using the best split among all variables [15]. It uses this produce for split selection and thus induce reasonably balanced trees where one global setting for the ridge value works across all leaves, thus simplifying the optimization procedure [16]. Decision stump Algorithm: It is a machine learning model consisting of a one-level decision tree. That is, it is a decision tree with one internal node (the root) which is immediately connected to the terminal nodes (its leaves). A decision stump makes a prediction based on the value of just a single input feature [15].
Comparison Between Algorithms
For comparison, the first experiment is performed on Weka with 10-fold cross-validation, the training set and split percentage (66%). The first step is to find the Confusion Matrix of the fish dataset using Random Tree, Decision stump, and j48 classification algorithms [17-28]. In the next step, experiment calculates the classification accuracy and Mean absolute error (Table 1).
Table 1: The Confusion Matrix.

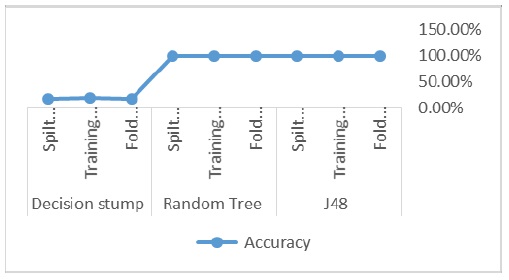
The simulation result shows that the highest correctly classified instances are (99%) out of 24572 instances by J48 Decision Tree and the lowest correctly classified instances is (19 %) by Decision Stump algorithm. The Random Tree Algorithm shows a closed result to J48 Algorithm which makes it in the second position. As the Figure 4 shows that J48 takes less time to classify data with 0.027 second average for all three test options. Moreover, Decision Stump takes 0.053 second average for all test options, but Random Tree takes more time to classify 24572 instances for about 0.157- second average (Table 2).
Table 2: Accuracy and mean absolute error.

The J48 algorithm and Random Tree algorithm both gives 99% accuracy in fold Cross Validation 10. In fact, the highest accuracy belongs to the J48 Decision Tree classifier, followed by Random Tree algorithm, and Decision stump Tree Classifier (Figure 5).
Figure 5: Accuracy Comparison.
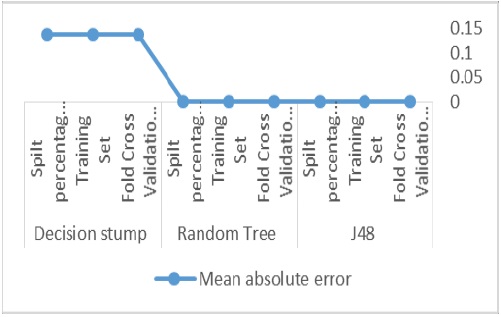
The average of mean absolute error of J48 algorithm for all test options is 0.0001 % and the average of mean absolute error of Random tree algorithm for all test options is 0.00023 %. But, the average of mean absolute error of Decision stump algorithm for all test options is 0.1392 %, which have more error than other algorithms (Figure 6).
Figure 6: Error Comparison.
Result and Discussion
Three experiments have been performed and tested to find percentage of correctly classified instances and information gain value for each factor. First, the whole dataset classified by the J48 algorithm and calculates information gain for each factor in the database. Second, the split data depend on year Quarter. Finally, the split data for each location with information gain calculation for each location. The purpose of dividing the dataset is to check the validity of the result of entropy for four factors that selected to study.
Experiment A
The accuracy percentage of whole dataset is 99% in 10- Fold Cross Validation and Spilt percentage (66%). On other hand, the accuracy percentage of whole dataset is 100 % in Training Set (Table 3).
Table 3: Detailed Accuracy by Class Weighted Average for Experiment A.

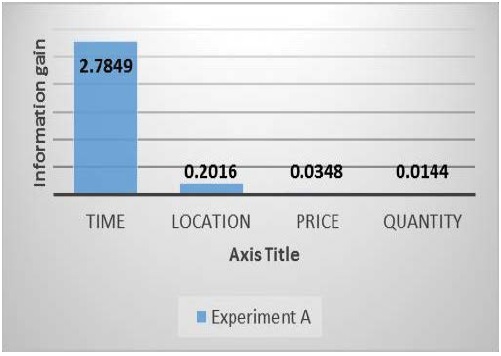
Ranked attributed are displayed according to the attribute selection that 2.7849 is with lead rank shown in first attribute name as Time and stand the first rank, the second attribute is the location with 0.2016, price and quantity take third and fourth rank position with 0.0348 and 0.0144 respectively (Figure 7).
Figure 7: IG for whole data.
Experiment B
The accuracy percentage of Experiment two for the first Quarter is 100 %. The accuracy percentage of Experiment two for the second quarter is 100 %. The accuracy percentage of Experiment one for the second quarter is 97%. The accuracy percentage of Experiment one for the second quarter is 96% (Table 4).
Table 4: Detailed Accuracy by Class Weighted Average for Experiment B.

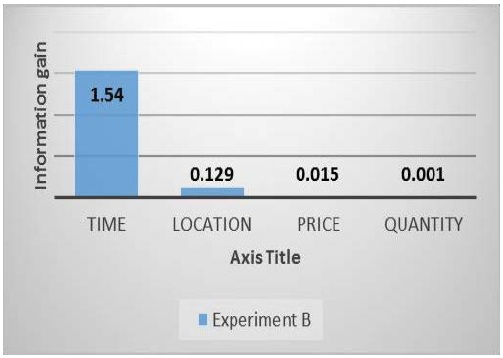
For experiment two, the result showed that Time has high rank all over other factors which are location, price and quantity. The result is almost similar to the result of first experiment. The following Figure 8 shows the average Ranked attribute values for all Quarters of year.
Figure 8: IG for divided Dataset by Time.
Experiment C
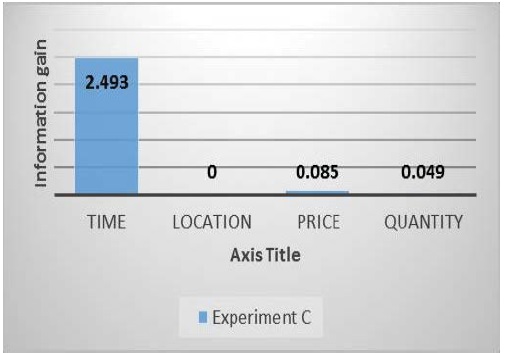
For experiment three, the result showed that Time has high rank all over other factors which are location, price and quantity. The price takes second rank and quantity takes the third rank position (Table 5).
Table 5: Detailed Accuracy by Class Weighted Average for Experiment C.

The result is same as the result of first experiment. The following Figure 9 shows the average Ranked attribute values for all locations:
Figure 9: IG for divided Dataset by location.
As a measure of the success of the model, the classification rate was used on the fold Cross Validation 10 test sample. For composing a decision tree model, J48 algorithms were used, where their functioning is high accuracy with fewer errors.
Comparative Analyses
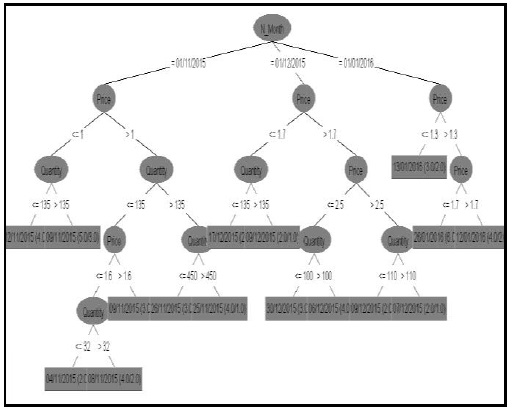
Since the goal of this research was to find the factor behind variation of fish price in Omani market. To achieve the goal, the J48 algorithm used to check the accuracy of data and we have succeeded in achieving our target by using this algorithm to classify the data accordingly. We find there is a relationship between J4 algorithm and attribute selection which known as information gain method and give the same result. The previous comparison shows that the J48 algorithm had the highest classification accuracy rate of 99.92%. By using the Weka environment to test the three experiments. The information gain for each attribute shows that Time has a direct impact on fish price and make it change over time. The location, where fisherman or customer catch or buy fish has a second impact of fish price. The quantity has less impact on fish price. The Figure 10 shows the ranked attributes in order before it tested by attribute selection algorithm. It is proved by this algorithm the order of each factor and how it impacts on fish price.
Figure 10: J48 decision tree.
The main factor influencing the change in fish prices is the Time as shown in Table 6, and the reason is that there are different fishing seasons that need to work out a schedule for fishing or increase fish production in ponds by raising fish in artificial ponds. Here, the lack of fish at the time increased the value of fish prices and vice versa (Table 6). The second factor is the place where the price of fish differs in the possibility of fishing for fish selling places in the markets and we notice the increase in prices in markets and decline in fishing places.
Table 6: Information gain for three experiments.

The third factor is the quantity, the higher the quantity the lower the price and the smaller the quantity, the higher the demand and the higher the price of fish.
Application Model
The proposed application model contains four parts. The First part is related to information gain calculation which used to find most affected factors that have a direct impact on fish price in a specific location inside sultanate of Oman. Second part is to find a specific fish type in different locations and to find whether it is available in that day or not. The third part contains a simple report which calculates average and sum of price for each fish types in the specific area. Finally, the last part which helps to find the specific fish type in a specific location and help the customer to find fish price suitable to his needs and requirement.
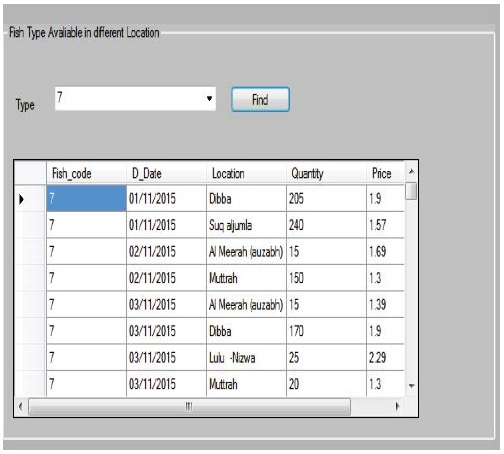
There are 15 types of fishes which are used in this study. Each fish type has specific price and quantity details depend on Time and location as indicated in the following Figure 11.
Figure 11: Fish Types with specific details.
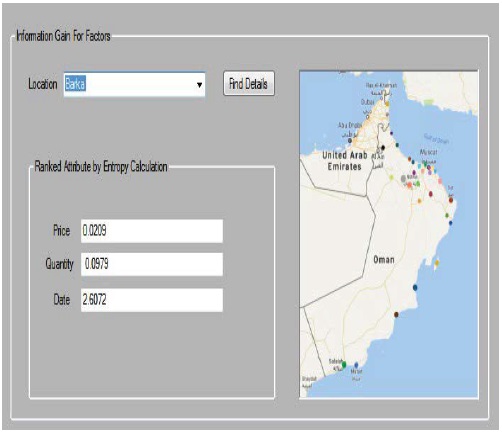
This section helps a customer to find which factor that effects on price and makes some change over time in a specific location. The code has been written to calculate entropy of each factor and provides result in text boxes that appear in Figure 12.
Figure 12: Entropy for location.
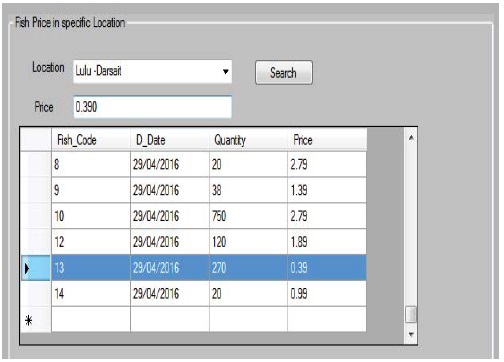
Third section, which helps customer to type price and location and he/she wants to find details about different fish types available in that location as indicated in the following Figure 13.
Figure 13: location and price choose.
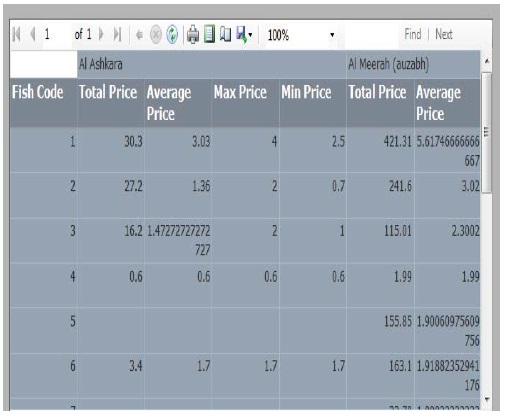
Last part is a simple report contains details about sum, max, min and average price for 29 location in Oman (Figure 14).
Figure 14: Fish Types report details.
Conclusion
The classification algorithm J48 has been chosen based on the different test results for building the application model. The test has been done to the attribute selection and a weighted average is calculated in percentages. Although cross-validation and split percentage shows huge differences, the training and cross-validation set almost produced the approximately similar result.
Based on the decision tree produced by the J48 algorithm, it is concluded that the most important factor that has effect on fish prices are a temporal factors (Time) only. This is due to different seasons of fish prices according to the four seasons and the possibility of the presence of a particular type of fish during the season. The more fish available in a season, the lower price of fish is identified and the less availability of fish, where the price is higher.
The application model designed to support the idea of factor analysis that can affect the difference in fish prices in a particular area. The application also provides information on fish in different areas and according to the price and quantity it needs.
Acknowledgment
This work was supported by a grant from TRC (The Research Council), Sultanate of Oman.
Alwatan Newspaper (2017) 6.1% increase in the Sultanate’s fish production during the first quarter of 2017. Economy Articles. [ Ref ]
h t t p : / / w w w . m a f . g o v . o m / p a g e s / P a g e C r e a t o r . aspx?lang=AR&DId=0&I=0&CId=0&C MSId=800746 [ Ref ]
Pandya JP, Morena RD (2017) A survey on association rule mining algorithms used in different application areas. 85: 1430-1436. [ Ref ]
Rajak A and Gupta MK (2012) Association rule mining: applications in various areas. Pp: 3-7. [ Ref ]
http://timesofoman.com/article/31777/Oman/Farm- and-fisheryvital- for-Oman’s-economy. [ Ref ]
http://timesofoman.com/article/112688. [ Ref ]
Salim Q (2010) Operating a wholesale fish market in the sultanate of Oman analyses of external factors.” Iceland: UNU-Fisheries Training Programme. pp: 1-44. [ Ref ]
Maribeth PA, Layza IAE, Jane RAK, Keene RFG, Jocel DR (2016) Factors affecting the market Price of fish in the Northern Part of Surigao Del Sur, Philippines. J Environ Ecol 7: 34-41. [ Ref ]
Bai A, Hira S, Deshpande PS (2015) An application of factor analysis in the evaluation of country economic rank. [ Ref ]
Nalluri MSR, Sujana TS, Reddy KH, Swaminathan V (2017) An efficient feature selection using artificial fish swarm optimization and svm classifier. International Conference on Networks & Advances in Computational Technologies (NetACT) pp: 20-22. [ Ref ]
Villacampa O (2015) Feature selection and classification methods for decision making: a comparative analysis. [ Ref ]
Hosseini SJF and Eghtedari N (2013) A confirmatory factorial analysis affecting the development of nanotechnology in agricultural sector of Iran. African J Agricultural Res Vol 8: 1401-1404. [ Ref ]
Jagtap SB and Kodge BG (2013) Census Data Mining and Data Analysis using WEKA. Cornell University Library pp: 1-6. [ Ref ]
Wikipedia Contributors (2015) ―C4.5_algorithm, ‖ Wikipedia, The Free Encyclopedia. Wikimedia Foundation. [ Ref ]
Wikipedia contributors (2014) Random_tree, ‖ Wikipedia, The Free Encyclopedia. Wikimedia Foundation. [ Ref ]
Andy L (2012) Documentation for R package random Forest. [ Ref ]
Koller D and Sahami M (1996) Toward optimal feature selection. Proceedings of the Thirteenth International Conference on Machine Learning. pp: 284–292. [ Ref ]
Almuallim H and Dietterich TG (1994) Learning boolean concepts in the presence of many irrelevant features. Artificial Intelligence 69: 279–305. [ Ref ]
Hacer Y, Aykut E, Halil E, Hamit, E (2015) Optimizing the monthly crude oil price forecasting accuracy via bagging ensemble models. J Economics Int Finance 7: 127- 136. [ Ref ]
Hall M, Frank E, Holmes G, Pfahringer B, Reutemann P, et al. (2009) The WEKA data mining software. ACM SIGKDD Explorations Newsletter 11: 10. [ Ref ]
Hall M, Frank E, Holmes G, Pfahringer B, Reutemann P, et al. (2009) The WEKA data mining software. ACM SIGKDD Explorations Newsletter 11: 10. [ Ref ]
Jing H, Sheng YN, Ying OH, Ze SY, Song CB (2013) Application progress on data mining in field of fishery production. J Agri Sci Technol 15: 176-182. [ Ref ]
Vasantha M and Bharathy VS (2010) Evaluation of attribute selection methods with tree based supervised classification-a case study with mammogram images. International J Computer Applications 8: 35-38. [ Ref ]
Chen T, Zhang C, Xu L (2016) Factor analysis of fatal road traffic crashes with massive casualties in China. Advances in Mechanical Engineering 8: 1-11. [ Ref ]
Kumbhare TA and Chobe SV (2014) An overview of association rule mining algorithms. Int J Computer Sci Information Technol 5: 927-930. [ Ref ]
http://en.wikipedia.org/wiki/Factor_analysis [ Ref ]
http://en.wikipedia.org/wiki/Weka_(machine_learni ng) [ Ref ]
Duch W, Winiarski T, Biesiada J, Kachel A (2003) Feature ranking, selection and discretization. Int Conf on Artificial Neural Networks (ICANN) and Int Conf on Neural Information Processing (ICONIP). pp. 251–254. [ Ref ]
