Journal Name: Scholar Journal of Applied Sciences and Research
Article Type: Research
Received date: 29 March, 2019
Accepted date: 10 April, 2019
Published date: 17 April, 2019
Citation: Almajali M, Mall S, Almahadin A (2019) Fretting Fatigue Behavior Under Phase Difference Between Axial and Contact Loads. Sch J Appl Sci Res Vol: 2, Issu: 5 (16-22).
Copyright: © 2019 Almajali M. This is an open-access article distributed under the terms of the Creative Commons Attribution License, which permits unrestricted use, distribution, and reproduction in any medium, provided the original author and source are credited.
Abstract
This paper presents an experimental study to investigate the effect of phase difference between axial and contact loads for fretting fatigue behavior of Ti-6Al-4V alloy. The samples were tested using a bi-axial servo-hydraulic test machine. The frequency of both axial and contact loads was kept constant at a value of 10 Hz. The applied axial stress was varied between 56 MPa and 564 MPa and the contact load was varied between 2224 N and 4448 N. Four phase angles between axial and contact loads were selected: 0°, 60°, 90° and 105°. In all tests, cracks were found to initiate at the contact surface near the trailing edge. The coefficient of friction was found to be smaller in tests carried out at outof- phase conditions compared to tests done under in-phase conditions. The crack initiation orientation for in-phase condition was similar to previous studies, however for the out of phase condition the crack initiation orientation deviated by 10°. For the in-phase condition, the fatigue life was almost the same as that for constant contact load which agrees with previous studies. However, the out of phase condition has increased the fatigue life by about 30%. In addition, life was doubled at 105° phase angle in comparison to the in-phase loading.
Keywords
Fretting Fatigue, In-phase, Out of phase, Crack initiation, Crack orientation.
Introduction
Fretting fatigue is generated at the contact interface between two components due to high resonance oscillation vibration of a small amplitude of relative movement. It is a critical wear process due to the creation of a state of stress and strain that reduces the material fatigue resistance and initiates a crack at the contact interface. This phenomenon causes a reduction of the material life in comparison to plain fatigue. It also results in the increase of the cost of components maintenance. Investigating fretting fatigue behavior is very important process for many industrial avenues including aviation sector due to its safety and economic impacts. There are many factors that have an impact on the behavior of the material under the state of fretting fatigue. These factors include: the contact load and the axial load conditions, the geometry of the contact parts, the coefficient of friction, elevated temperature, interface shear stress, corrosion, shoot-peening treatment, etc. Several studies have been conducted to investigate these factors.
The coefficient of friction was investigated in many studies [1-5]. They revealed that the variation of friction coefficient from 0.40 to 0.75 results in small variation in fretting fatigue variables. It is reported also that the coefficient of friction can lead to a risk of the crack nucleation of the fretting fatigue [6]. Pad geometry, on the other hand, was studied by Lykins [2] and Namjoshi [4,7] who found that the fretting fatigue life was significantly reduced relative to plain fatigue life regardless of pad geometry. Madhi [8] reported that the pad geometry has less effect on the fatigue life of IN-100 alloy compared to titanium alloy. Iyer [1] has also investigated the variation of the magnitude of the applied contact load under different frequencies for Ti-6Al-4V. He found that if the contact load increased at 1 Hz the fatigue life reduced. While at high frequency (200 Hz), increasing the contact load has no effect on fatigue life. Lee [5] found that the fatigue life was primarily dominated by the axial load. Lee et al. [9,10] also investigated Ti-6Al-4V specimens under the influence of various temperature values, i.e. 25˚C, 100˚C, and 260˚C. They concluded that there was no effect on fretting fatigue life by increasing temperature up to 260˚C. Terres et al. [11] conducted an experimental study on the effect of shotpeening on the fatigue behavior of 42CrMo4 steel. They found that this method can minimize the propagation of the crack by developing a compressive residual stresses.
The history of the stress and strain of the plain fatigue was used to develop the predictive parameters which in turn used for the fretting fatigue data. For fretting fatigue, these parameters can be used to predict: the location of the crack initiation, its angle and time of failure. The fatigue life in fretting fatigue conditions is mostly consumed in the crack nucleation until the crack reaches a noticeable size. The remaining life is expended in propagating the crack propagation to reach the critical size. For any material and under the same axial load conditions, fretting fatigue reduces the material life more compared to the plain fatigue life [2, 8,12].
Most of the previous studies were conducted under constant applied contact load while limited studies considered variable contact load. Most importantly, none of these studies have considered the phase difference between the axial and the contact loads. Hence, the aim of this study is to investigate the fretting fatigue behavior of titanium alloy (Ti-6A1-4V) under the effect of phase difference between the applied contact and axial loads. This will provide a better understanding of the fretting fatigue behavior especially for applications where the contact and the axial loads are at out of outof-phase condition. Titanium alloy (Ti-6A1-4V) is used in this study due to its potential properties such as excellent corrosion resistance, low density and high tensile strength. Those properties made titanium alloy a very good candidate for many industrial and engineering applications. The fatigue life of Ti-6A1-4V is determined under different phase angles and is compared to the plain fatigue. Additionally, the structure of the contact area is investigated to determine the crack initiation and propagation.
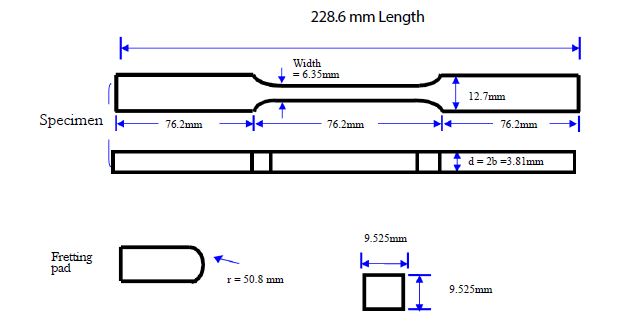
Figure 1:The geometry and dimensions of the Specimen and the pad.
Experimental Set Up
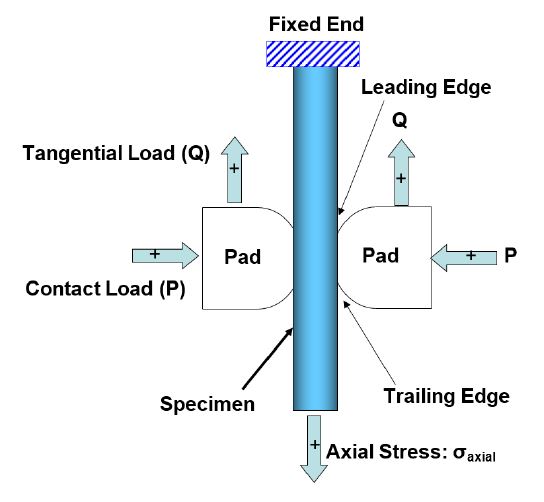
In this study, titanium alloy Ti-6A1-4V was used which has the following properties: Elastic modulus (E) of 126 GPa, Yield strength (σy) is of 930 MPa, Poisson’s ratio (υ) of 0.33, Brinell hardness number of 302 and measured grain size of 10 μm. Figure 1 shows the pad geometries and the specimen which has a cross section area of 24.1935 mm2. The samples were tested using a bi-axial servo-hydraulic test machine. The schematic diagram of the installation of the specimen on the machine is shown in Figure 2. This figure exhibits all the loads applied on the specimen (axial load, contact load and tangential load) in addition to the direction of the sample movement (leading and trailing edge). The actuators of the machine are controlled by Multi Test System MTS 793.10 and Multi-Purpose Test Software (MPT). MPT permits the operators to change all parameters related to fretting fatigue such as magnitude, frequency, waveform, and phase lag between the actuators. The actuators allow the users to apply the axial and the contact loads at the same time. The 100 kN upper hydraulic servo actuator controls the axial load while the lower axial servo-hydraulic load cell measures the variation of the axial load. On the other hand, the left fretting servo-hydraulic controls the contact load and its cell measures the variation of this load.
The accuracy of pad alignment is very critical in order to make sure that the axial and contact loads are perpendicular to each other. Preliminary steps have to be carried out to make sure that the pads are perpendicular to the specimens. Also, to verify the functionality of the machine, a warm up
| Test # | σ maxMPa | σ minMPa | PMax N | PminN | phase _ angle (degree) Degree |
|---|---|---|---|---|---|
| 1 | 564 | 56 | 4448 | 2224 | 0° |
| 2 | 564 | 56 | 4448 | 2224 | 90° |
| 3 | 564 | 56 | 4448 | 2224 | 60° |
| 4 | 564 | 56 | 4448 | 2224 | 105° |
Table 1:Input loads for phase change experiments.
Figure 2:Schematic diagram of the configuration of fretting fatigue.
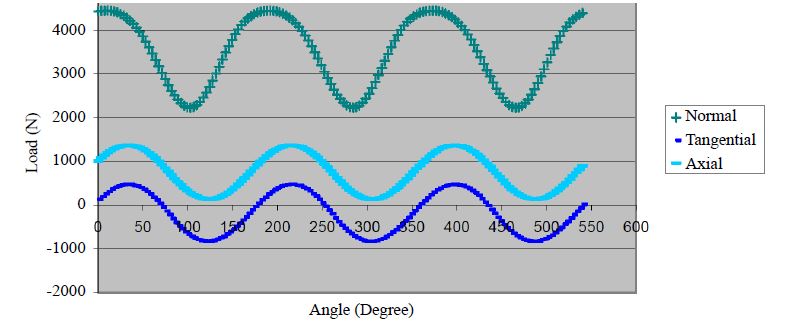
Figure 3:Loads vs angle for test # 1 at 10,000 cycles (in-phase condition).
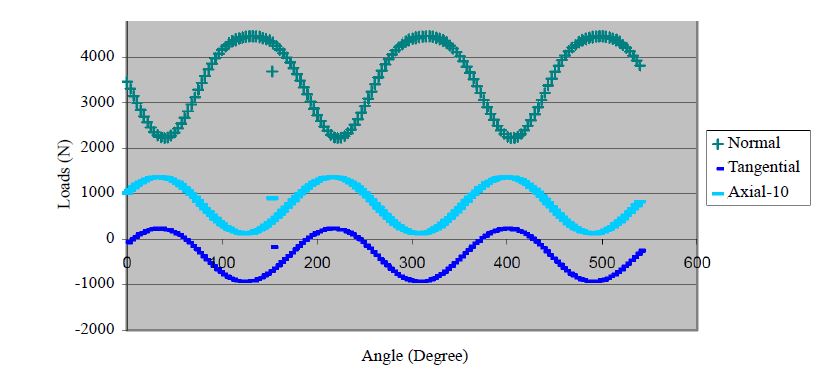
Figure 4:Loads vs angle for test # 2 at 10,000 cycles (out-phase condition).
for 30 minutes without specimens is performed. The contact and axial loads are applied gradually to reach their maximum magnitudes. The condition of applied axial load was in tension- tension and varying between 56 MPa and 564 MPa. The contact load was varied between 2224 N minimum to 4448 N maximum. The applied frequency was chosen to be 10 Hz and four different phase angles between the axial and contact loads were selected (0°, 60°, 90° and 105°). Tables 1 shows the data for the four experiments conducted in this study. Tests were run until the samples failed. The following parameters are recorded: the lower and upper axial loads, the contact load, the running time, and the displacement.
The contact region between the specimen and the pad was investigated. For that end, a magnification microscope and the Scanning Electron Microscope (SEM) were used to see the fracture surface of the specimen in higher magnification. To fit the specimen inside SEM, it was cut along y-direction and 10 mm length in x-direction. The surface area was then trimmed to reach a clear SEM picture. Finally, the crack initiation orientation was evaluated using the desired picture from SEM. The orientation angle was also measured using the trimmed cutting part.
Results and Discussion
In this study four (4) experiments were conducted on titanium alloy Ti- 6A1- 4V under phase difference between the axial load and the applied contact load.
| Test # | Phase Angle Degree | f = Q/P |
|---|---|---|
| 1 | 0° | 0.3534 |
| 2 | 60° | 0.3099 |
| 3 | 90° | 0.2144 |
| 4 | 105° | 0.3475 |
Table 2:Coefficient of friction values for all tests.
Coefficient of friction
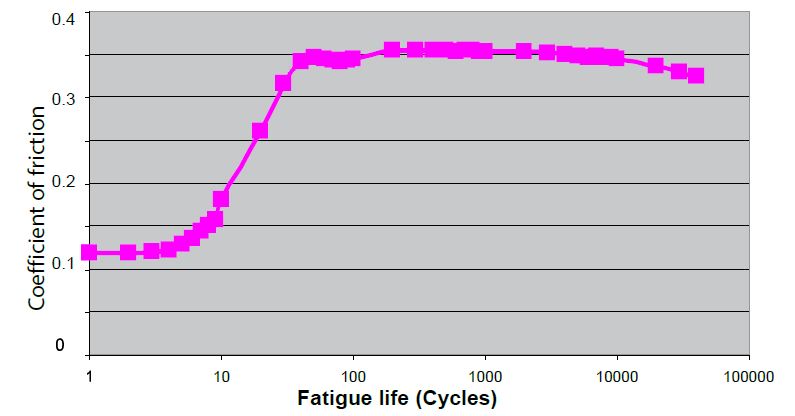
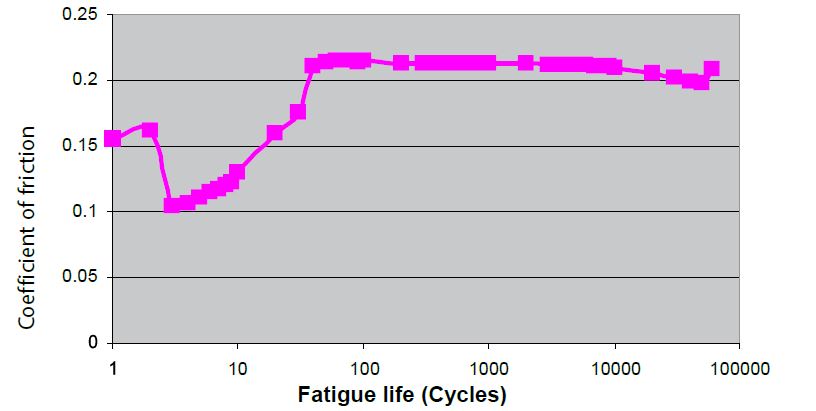
The first parameter to be calculated is the tangential load (Q) which is determined as half of the difference between applied lower axial load and the load measured at the upper grip. Figures 3 and 4 show the behavior of the tangential load along with the axial and the contact loads for in-phase and out-phase conditions respectively. It is found that the variation of the tangential load phase is similar to the axial load while its magnitude is affected by the contact load. Based on the calculated tangential load (Q), the coefficient of friction (f) was calculated as f=Q/P. The largest value of coefficient of friction is measured at in-phase condition (0.3534). While the smallest value is measured at out-phase condition (0.2144) as shown in Table 2. This is the first indication that the material life will be more in out-phase condition comparing to in-phase condition. The variation of (f) with respect to time for test 1 and test 2 are shown in Figures 5 and 6 for in-phase and out-phase conditions respectively. This variation was taken at 10,000 cycles. As a result, the coefficient of friction was not treated as a constant value and its variation under the condition of fretting fatigue was considered.
Figure 5:Coefficient of friction vs. life cycles for test#1 (in-phase).
Figure 6:Coefficient of friction vs. life cycles for test # 2 (out-phase).
Contact surface area
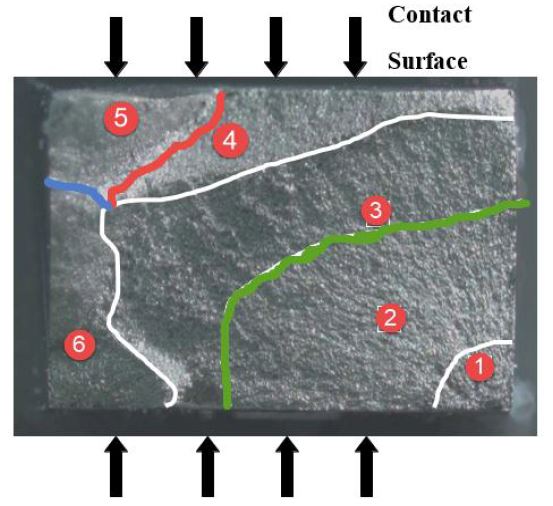
The surface of the cross-section area was investigated by SEM. Figure 7 shows a photo of the failed specimen for test 2 (Out-phase) which represents the lower side of the specimen. It can be seen that at the fracture surface, there are different distinguishable regions that were created during the crack initiation and propagation. Region 1 contains debris due to the created wear from the damaged surface that nucleates the initial crack. Region 2 represents the main area for the crack propagation while in region 3 there are large dimples with grain boundary. The catastrophic fracture was noticed in regions 4, 5 and 6 where the final and the unstable crack occurred. However, it is important to state that the appearance of the various areas is influenced by the coarseness of surface created relative to the point of crack initiation which resulted in dividing the surface into 6 areas. It is imperative in fretting fatigue tests to specify the location where the crack initiated. The tests carried out in
| Test # | phase _ angle (Degree) | Cycle Nf |
|---|---|---|
| 1 | 0° (In-phase) | 47,298 |
| 2 | 90° (Out-phase) | 61,428 |
| 3 | 60° | 69,149 |
| 4 | 105° | 90,528 |
Table 3:Measured fatigue life for the tests conducted under phase angle.
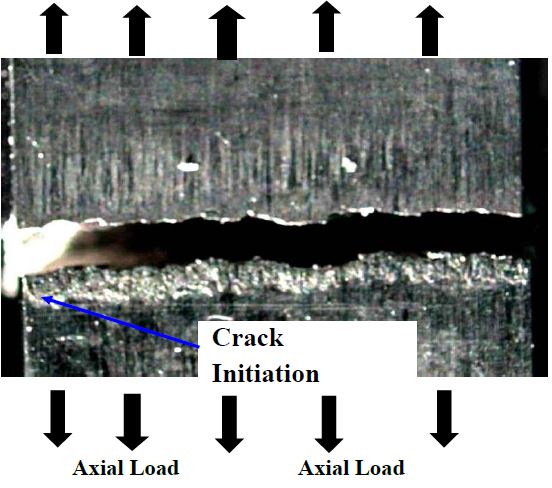
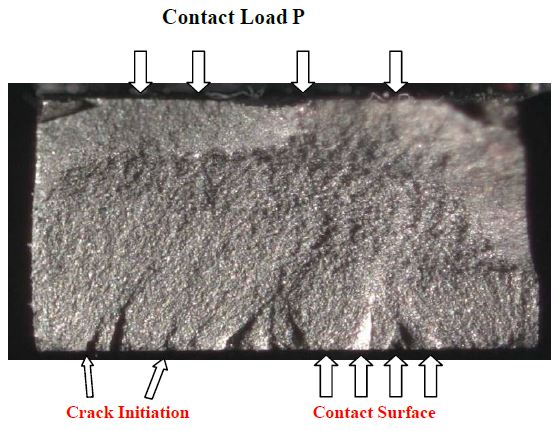
this study showed that the location of the crack initiation is at or very close to the trailing edge of the contact region. For example, test 1 in Figure 8 shows that the location of the crack initiation is at the trailing edge. Figure 9 depicts that the crack was initiated at the contact surface as shown in the darker area. The trailing edge area matches to the point where the maximum axial load is applied. So, if the crack is initiated at a serious size, it is predicted that the maximum axial load will propagate this crack at the trailing edge area. Based on Magaziner study [13], the shifting of the stick zone causes the stress concentration to be formed at these zones. This stress concentration is the reason to initiate the crack in the trailing edge area.
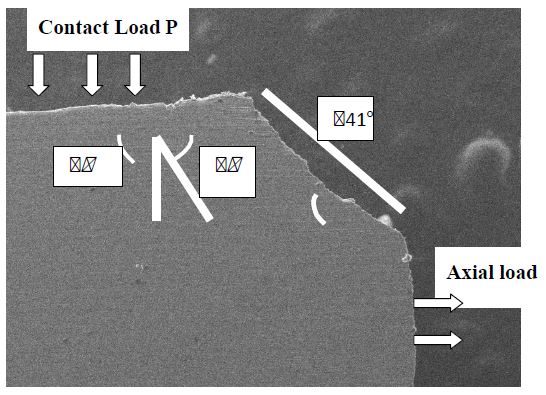
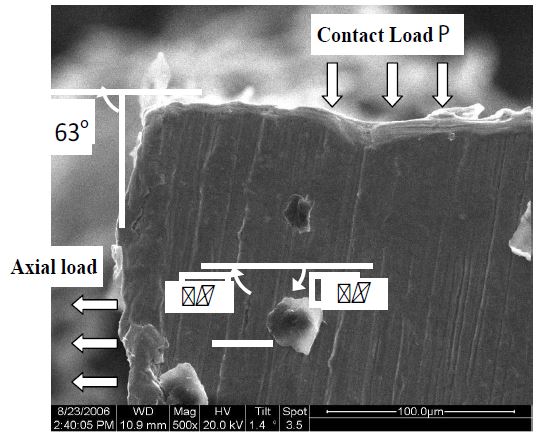
In number of studies [2,4,7], it was reported that the crack initiation orientation under constant contact load is about +45° or -45° ±15°. Lee [5] also showed that the crack orientation, under variable contact load was - 50°. He also documented that, with different frequencies, the variable applied contact load has similar influence on the crack initiation orientation as the constant applied contact load. In this study, test 1 (in-phase) and test 2 (out-phase) were investigated to check the crack initiation orientation. Figure 10 shows the crack initiation orientation for test 1 (in-phase) with an angle of around 41°. The result for test 1 is very close to results from previous studies. However; for test 2 (out-phase) Figure 11 shows that the angle of crack initiation is around 63°. There is a deviation about 10° from the expected values. This can be explained based on the change in the shear stress and in the contact stress when goes from in-phase condition to out-phase condition. So, it can be concluded that the crack initiation orientation for out-phase condition is around +55° or 55° ±15°.
Fretting fatigue life
The motivation behind this study was to observe the effect of out-phase condition on the fretting fatigue life of titanium alloy. The coefficient of friction was found to be smaller in tests carried out at out-phase condition compared to the tests done under in-phase conditions. The crack initiation orientation for in-phase condition was similar to the previous studies, however for the out of phase condition the crack initiation orientation deviated by 10°. The axial stress concentration factor for out-phase condition is less than in-phase condition. Also, the fretting fatigue behavior was affected only by the magnitudes of the applied load while the sequence of applying these loads has no effect.
Additionally, Table 3 shows the measured fatigue life for the tests conducted in this study. It is verified that the material will stay longer if there is a phase lag between the axial and contact loads. The life increases 30% under outphase condition compared to in-phase one. At phase lag of 105°, the life is almost doubled. Results showed that if there
Figure 7:Fracture surface for test # 2 along with six distinguishable regions.
Figure 8:Crack initiation location for test # 2.
Figure 8:Crack initiation location for test # 2.
Figure 9:Crack initiation location and contact surface for test # 2.
Figure 10:Crack initiation orientations for test 1 (in-phase).
Figure 11:Crack initiation orientations for test 2 (out of phase).
is a phase difference between the axial and the contact loads, the fatigue life is higher than in-phase conditions. However, it is to be considered that the increase in fatigue life depends mainly on the magnitude of the applied axial load. e. g. if the applied axial load is high, the increase in life is moderate. On the other hand, if the axial load is low, the fatigue life is almost doubled. The results from this study are very close to results from the previous studies.
Conclusion and Recommendations
Fretting fatigue was investigated through an experimental study of the effect of phase difference between axial and contact loads using Ti-6Al-4V alloy. The phase angle was varied between 0°, 60°, 90° and 105°. The effect of out of phase condition on fretting fatigue can by summarized as follows:
• The fatigue life with in-phase variable contact load was almost same as that of constant contact load.
• The coefficient of friction was found to be smaller in test carried out at out-phase condition compared to in-phase conditions.
• Under both in-phase conditions and phase lag conditions, the tangential load was varying similar to the axial load. The contact load only affects the magnitude of the tangential load.
• The location of the crack initiation for all tests was always found to be at the trailing edge of the contact region.
• The crack initiation orientation for in-phase condition was similar to the previous studies, however for the out of phase condition the crack initiation orientation deviated with 10°.
• The maximum load condition of the out-phase conditions can be assumed at the axial load, as in-phase cases.
• The axial stress concentration factor for out-phase condition is less than in-phase condition.
• The fretting fatigue behavior was affected only by the magnitudes of the applied load and not the sequence of applying these loads has no effect.
• The major finding from this research is that the out of phase condition increased the fatigue life about 30%.
• Interesting and useful results were found from this investigation. However, there are still number of areas that can be investigated to improve the understanding and to practically utilize the out-phasing of axial and contact loads. This as a result will improve the freeing fatigue life. The following are recommended:
• Investigating other phase angles and up to 180 degrees.
• Investigating the effect of high temperatures in combination with various phase angles and up to 180 degrees.
• Investigating the out of phase condition at low cycle and high cycle.
Iyer K, Mall S (2000) Effects of Cyclic Frequency and Contact Pressure on Fretting Fatigue under Two-level Block Loading. Fatigue Fract Engg Mater Struct 23: 335-346.[ Ref ]
Lykins CD, Mall S, Jain VK (2001) A Shear Stress Based Parameter for Fretting Fatigue Crack Initiation. Fatigue and Fracture of Engineering Materials and Structures 24: 461-473.[ Ref ]
Iyer K, Mall S (2001) Analysis of Contact Pressure and Stress Amplitude Effects on Fretting Fatigue Life. Journal of Engineering Materials and Technology 123: 85-93.[ Ref ]
Namjoshi SA, Mall S, Jain VK, Jain O (2002) Effects of Process Variables on Fretting Fatigue Crack Initiation in Ti-6Al-4V. Journal of Strain Analysis 37: 535-542.[ Ref ]
Chia-hwa L (2004) Effect of variable contact load on fretting fatigue behavior of shot- peened and un-peened titanium alloy. Thesis AFIT/ GAE/ENY/04-D01.[ Ref ]
Juoksukangas J, Lehtovaara A, Mäntylä A (2013) The effect of contact edge geometry on fretting fatigue behavior in complete contacts. Wear 308: 206-212.[ Ref ]
Namjoshi SA, Mall S, Jain VK, Jin O (2002) Fretting Fatigue Crack Initiation Mechanism in Ti-6Al-4V. Fatigue Fract Engng Master Struct 25: 955-964 .[ Ref ]
Madhi (2006) Fretting fatigue behavior of Nickel alloy IN-100. Thesis AFIT/GAE/ENY/06-M22.[ Ref ]
Lee H, Jin O, Mall S (2003) Fretting Fatigue Behavior of Shot-peened Ti- 6Al-4V at Room and Elevated Temperature. Fatigue Fract Engng Master Struct 26: 1-12.[ Ref ]
Lee H, Mall S (2004) Stress Relaxation Behavior of Shot-peened Ti-6Al- 4V under Fretting Fatigue at Elevated Temperature. Materials Science and Engineering A 366: 412-420.[ Ref ]
Terres MA, Laalai N, Sidhom H (2012) Effect of nitriding and shotpeening on the fatigue behavior of 42CrMo4 steel: Experimental analysis and predictive approach. Mater Des 35: 741-748.[ Ref ]
Yuksel HI (2002) Effects of Shot-peening on High Cycle Fretting Fatigue Behavior of Ti-6Al-4V. MS Thesis AFIT/GAE/ENY/02-12. Air Force Institute of Technology (AU), Wright-Patterson AFB OH.[ Ref ]
Maganizer RS (2002) Examination of Contact Width on Fretting Fatigue. PhD dissertation, Graduate School of Engineering, Air Force Institute of Technology (AFIT), WPAFB.[ Ref ]
