Journal Name: International Journal of Cancer and Treatment
Article Type: Research
Received date: 01 March, 2018
Accepted date: 15 March, 2018
Published date: 05 April, 2018
Citation: Kansara S, Parabia FM, Badgujar N, Mistry K (2018) Effect of Methyl Jasmonate on A-549 Lung Cancer Cell Line and Docking with GLUT 1 and HK2 Targeted Proteins. Int J Cancer Tremnt. Vol: 1, Issu: 1 (01-09).
Copyright: © 2018 Kansara S, et al. This is an openaccess article distributed under the terms of the Creative Commons Attribution License, which permits unrestricted use, distribution, and reproduction in any medium, provided the original author and source are credited.
Abstract
Objective: Methyl jasmonate (MJ) is a lipophilic volatile organic compound originated as stress hormone in plants. MJ is involved in plant defense and many other diverse metabolic pathways. This hormone is produced against biotic and abiotic stresses of plant through map kinase pathway. MJ has therapeutic potential in human having selective antiproliferative effect on cancerous cells without interfering normal cell growth.
Methodology: Human lung cancer cell lines (A-549), were treated with different concentrations of MJ. Viability of cancer cells were measured by MTT assay. In silico docking of MJ was done with the involvement of Auto dock tool 2.6, Marvin view 5.8.1, CLC main work bench 3.0 and Discovery studio 3.0.
Result: Sub-cytotoxicity of MJ with increasing concentration 0.31, 0.62, 1.25, 2.5, 5 and 10 mM were attenuated cell viability 91, 89, 87, 76, 50 and 21 percentages respectively. MJ was docked with the lung cancer cell glucose uptake channel transport protein named Glucose transporter 1 (GLUT1) and hexokinase 2 (HK2). Blocking of these two proteins in lung cancer cells are turned to hypoxic condition without primary source of glucose resulted into apoptosis of the cell.
Conclusion: MJ directly binds GLUT1 with free energy for binding -4.91kcal/mol, which blocks glucose uptake in high glycolytic tumor cell. MJ also binds with hexokinase-II (HK2) with free energy for binding +13.69kcal/mol, which detach HK2 from voltage dependent anion channel (VDAC).
Keywords
Lung cancer; Methyl jasmonate, Glucose transporter 1, Hexokinase-II, Voltage dependent anion channel.
Introduction
Lung cancer is the most frequently occurring cancer in the world causes 1.38 million 18.2% of the total cancer deaths per year [1]. Lung cancer is classified as both small cell lung carcinoma (SCLC) and non- SCLC (NSCLC). Majority patients of NSCLC are diagnosed at an advanced stage because of poor clinical outcome resulted into low survival. It comprises 80% of all lung cancer. SCLC is caused by smoking and carcinogenic nicotine in cigarette smoke. Lung cancer survivals at 5 years after diagnosis are 15% in US and 8.9% in developing countries [2], the limited diagnosis potential causes detection at advance stage of the disease [3]. Different therapeutic techniques such as chemotherapy, radiotherapy and cryosurgery control or kill lung cancer cells along with side effects [4].
Therefore, more specific targeted therapy with better prognosis is required. Methyl jasmonate (MJ) is a stress hormone of plants. It is oxylipid and volatile compound. Plants produced MJ during abiotic as well as biotic stress, which works as signaling molecule and intimate another plant of the same species to trigger their defense mechanism against the respective stress [5]. Recent evidence shows that MJ can inhibit melanoma cell migration and suppress the development of melanoma growth in mouse lungs [6]. However, in human, MJ has shown therapeutic potential against cancer cells both in vitro and in vivo, without affecting normal cells. Therefore, MJ is a promising agent for the development of cancer therapeutics. U.S. Federal Environmental protection Agency (EPA) found that the toxicity data demonstrated that MJ is virtually non-toxic for human through all routes of exposure, including oral [7]. It is safe and can be natural part of human diet having antiproliferative effect only on cancerous cell. MJ has highly anti cancerous activity against all type of cancers [8]. MJ performed its action on cancerous cells by multifaceted modes. In the present study we have focused on effect of MJ on A-549 lung cancer cell line and evaluating in silico targeted site for MJ through microarray data analysis.
Materials and Methods
Cell Culture
Lung cancer cell-line A-549 was procured from NCCS, Pune, India. DMEM-F12 medium (Gibco), supplemented with 10% fetal bovine serum (Gibco) and penicillin (100 U/ml) was used as culture medium. Cells were maintained at 37°C (95% humidity with 5% CO2). MJ (Sigma) was dissolved in a concentration of 10 mM in dimethyl sulfoxide (Sigma) and stored at −20°C. Confluent monolayers of cells were incubated with different concentrations of MJ. The 50% inhibitory concentration (IC50) measured after 24-hour exposure of MJ [9].
Measurement of Cell Viability with MTT Assay
Cancer cells were cultured in 96-well plates at 5×10⁴ cells per well and treated with different concentration of MJ. Cell viability was monitored by 2-(4, 5-dimethyltriazol-2-yl)-2, 5-diphenyl tetrazolium bromide (MTT, Sigma) colorimetric assay [10]. All experiments were repeated three times. Absorbance was measured at 570 nm and background absorbance was measured with a reference filter 630 nm [11]. Cell viability was calculated by using the formula: Cell viability = [O.D. of Blank – O.D. of Test]/O.D. of Blank.
Microarray Data Analysis
Gene expression microarray data was obtained from genome scale transcriptome analysis of lung cancer cell and normal lung cell.
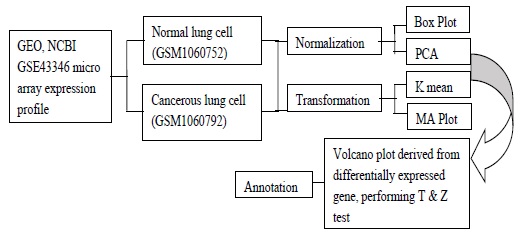
Gene Expression Omnibus (GEO): The data was collected from GEO dataset accession number GSE-43346 from NCBI in download section the SOFT-file format is simple line-based contained all the data and descriptive information of a microarray experiment [12]. Figure 1 Indicates process of the simple flow of microarray data. The downloaded experiment microarray data groups were normal lung cell (GSM1060752) (group-1) and cancerous lung cell (GSM1060792) (group-2). Differential gene
Figure 1: Process indicates flow of wet lab work, to extracted data from GEO database, making experiment in CLC workbench using extracted micro array data furthermore, transformation, normalization and annotation of microarray raw data to get highly differentially expressed proteins.
Gene Expression Omnibus (GEO): The data was collected from GEO dataset accession number GSE-43346 from NCBI in download section the SOFT-file format is simple line-based contained all the data and descriptive information of a microarray experiment [12]. Figure 1 Indicates process of the simple flow of microarray data. The downloaded experiment microarray data groups were normal lung cell (GSM1060752) (group-1) and cancerous lung cell (GSM1060792) (group-2). Differential gene expression was carried out in CLC main work bench and Kal et al.’s test (Z-test) based calculation. Genes were filter out based on p-value <0.0005 and fold change difference >1 [13]. Find target proteins by using annotation file in HG-U133 platform. The values obtained through CLC work bench were (1) Range: The value indicates the difference between the highest and the lowest expression value for the array over normal lung cell and cancerous lung cell. (2) IQR: Indicates the inter-quantile range of the values for the array across the samples, that is, the difference between the 75% percentile value and the 25% percentile value.
The IQR is set to be the difference between the highest and lowest values. (3) Difference: Value contains the difference between the mean of the expression values across the samples assigned to group 2 and the mean of the expression values across the samples assigned to group 1. (4) Fold Change: Indicates that how many times bigger the mean expression value in group 2 is relative to that of group 1 [14,15]. Quality control test of these comparing groups of data is done by transformation process which scrutinize to what extent the inconsistency in expression values is depends on the mean. This was done by MA Plot helps for pair wise comparison of each array to a pseudoarray containing the median intensities of all the probe sets over all arrays and make pair wise comparisons between all arrays. Transformation procedure is to take the logarithm based on 2 value of the expression ratio (Log2 [expression ratio]) [16,17]. This has the major advantage that it treats differential up-regulation and down-regulation equally. Need to ensure that all the samples are comparable.
Normalization: Systematic differences between the samples that are likely due to noise (e.g. differences in sample preparation and processing) relatively than true biological changeability should be aloof [18]. Box plot is used to examine and evaluate the overall allocation of the malformed expression values of normal lung cell and cancerous cells. Box plot evaluates the scale and distribution of the logtransformed data on the different arrays is analogous. Differences in shape or center of the boxes indicate that normalization of the data is required to make transcriptom data completely comparable [19]. Quantile normalization is statistical technique to make the distributions of the expression values identical between normal and cancerous lung cell. An additive linear model is fit to the normalized data to obtain an expression measure for each probe on each Gene Chip. The linear model for a probe set can be written as, Yij= mi+ aj+ eij. Where, Yij denotes the normalized probe value corresponding to the ith Gene Chip and the jth probe within the probe set, mi- denotes the log-scale expression for the probe set in the sample hybridized to the ith Gene Chip, aj- denotes the probe affinity effect for the jth probe within the probe set, and eij- denotes a random error term. Tukey’s median polish is used to obtain estimates of the mi values. These estimates serve as the log-scale expression measures associated with the probe set [20,21].
Principal Component Analysis (PCA): Transcriptome data of normal and lung cancer cell line has to be relatively homogenous with significantly apparent for principal component analysis (PCA) [22]. PCA is a standard technique for visualizing high dimensional data and for data preprocessing. Quality control analysis is done by calculating distance between transcriptome data of normal and lung cancer cell line. Euclidian distance (E) matric is probably the most familiar distance metric since it reflects the distance between two objects in space (= the straight ‘as-the-crowflies’ distance). Distances can range from 0 to positive infinity. The given equation indicates that the genes with expression data available for n- conditions, represented as x= [x1, ..., xn] and y= [y, ..., yn]. Euclidean distance between two genes is the square root of the sum of the squares of the distances between the values in each condition (dimension) [23].
Transformation
Now, identify the genes that are differentially expressed (= genes with significantly higher expression in one group compared to the other group) is done by gaussian data T-test statistical analysis. T-test ‘Homogeneous’ use to compare two groups and calculation is done assuming that the group have equal variance. Kal et al.’s test (Z-test) [24], compares a single sample against another single sample, and thus requires that each group in you experiment has only one sample. The test relies on an approximation of the binomial distribution by the normal distribution. Now, the volcano plot shows the relationship between the p-values of a statistical test and the magnitude of the difference in expression values of the samples in the groups. On the y-axis the minus values of log10 (p-values) are plotted and imported the annotation file on HG-U133 platform [25].
Molecular Docking: Marvin View, Autodock and Discovery Studio were used for performing docking and docking related study.
- 1) Autodock tool 2.6 is a suite of automated docking tools. It is designed to predict how small molecules, such as substrates or drug candidates, bind to a receptor of known 3D structure. Main application of autodock tool is in, structure-based drug design; protein-protein docking and chemical mechanism studies [26].
- 2) Marvin view 5.8.1 is utilized to visualize various atom properties such as atom numbers, lone pairs, atom mapping, graph invariants and R-groups. 2D and 3D coordinates can be rendered in various ways such as ball and stick, wireframe and space filling. Saving chemical structures with molecule name, IUPAC names and SMILES string which can also be visualized further [27,28].
- 3) Discovery studio 3.0 software provides comprehensive modeling and simulation capabilities for computational chemists, computational biologists, and other scientists engaged in small molecule and biotherapeuticsbased research. Applied for small molecule drug design and market-leading biological simulation tools. It is developed and distributed by Accelrys [29].
Results
Cell Viability Measurement
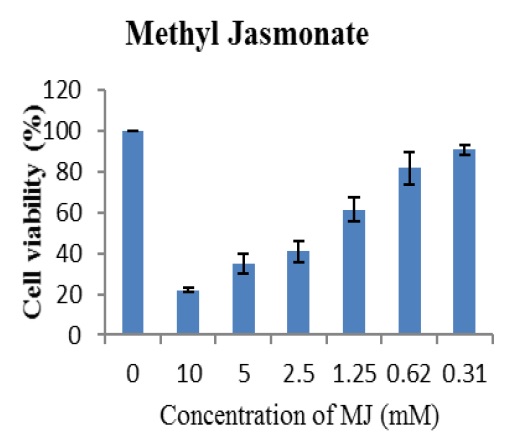
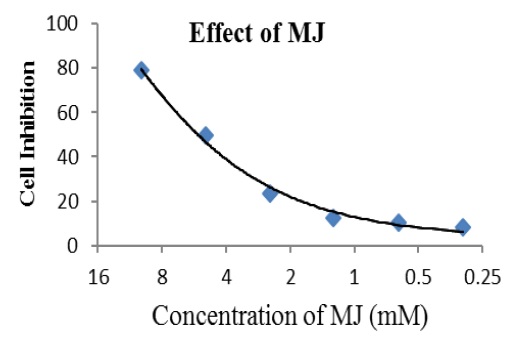
Increase concentration of MJ subsequently 0.31, 0.62, 1.25, 2.5 5 to 10mM resulted into decrease cell viability respectively 91, 89, 87, 76, 50 and 21% Figure 2 with IC50 and IC90 values respectively 4.937mM and 7.822mM Figure 3. Thus, MJ had significant concentration dependent inhibition on viability and proliferation of A-549 cancer cells.
Figure 2: MTT colorimetric assay indicated that MJ suppressed the cell viabilities of lung cancer cells (A-549) with increase concentrations of MJ.
Figure 3: Graph indicates logarithmic conversion based on 2 of molar concentration of MJ against cell viability of A-549 cancer cells indicates IC50 and IC90 values 4.937mM and 7.822mM respectively.
In silico Gene Expression Analysis
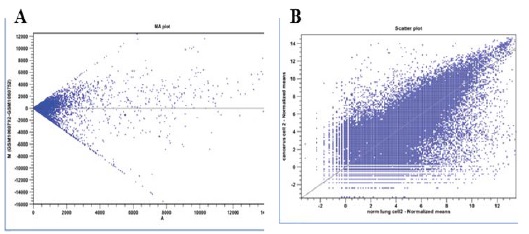
Differential gene expression data was collected from the NCBI database GEO (Gene Expression Omnibus) accession number GSE-43346 [30]. MA plot is designed to measure array quality to see variance in expression value which depends on mean. In a MA-plot, Figure 4A on x-axis A is plotted versus M in untransformed data, M is the difference between the intensities of a gene on both arrays (Intarray 2–Intarray 1) and A is the average intensity for a gene ((Intarray2+Intarray1)/2). Intarray 1 is normal cell line and Intarray 2 is cancer cell line. Figure 4B indicating scatter plot after log2 transformation. ;
.
Figure 4A: MA plot perform pair wise comparison between all array and shown differential expression of genes.
Figure 4B: Log transformation of data indicates less dependency. (M is the log intensity ratio indicates difference between log intensities, and A is the average log intensity for a gene on the arrays).
In Figure 4A, the cloud of data points in the MA-plot is centered on M=0 (light grey line) because most of the genes are not differentially expressed. Additionally, the variability of the M values should be similar across different array-array combinations. Plot indicates that the variance increases with the average intensity. The data has been log-transformed to remove some of the dependency Figure 4B. Additionally, the log transformation will make the data less skewed and more normally distributed which provide an equal spread of upand down regulated expression ratios.
Box Plot
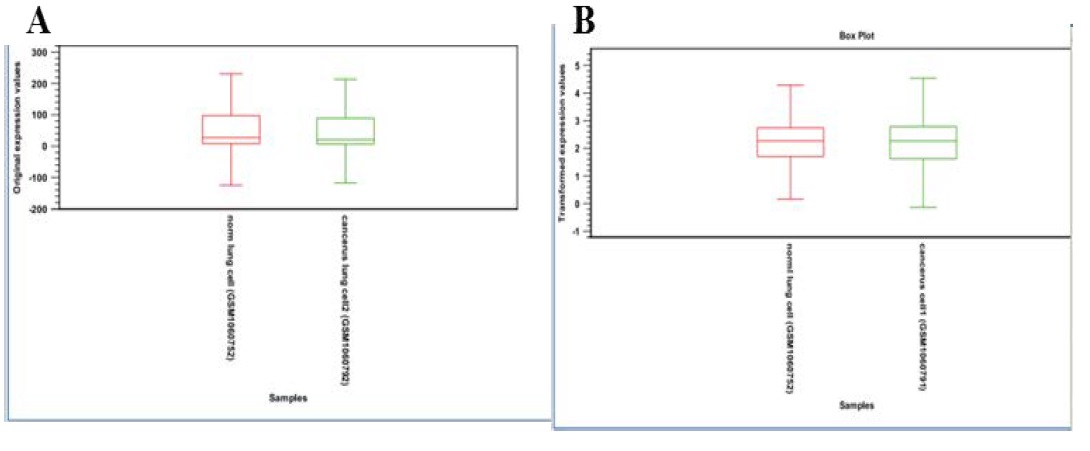
Box plot consist median, upper and lower quartile range, show individual extreme value, it assess the scale and distribution of data is comparable (normalization of data).
Box plot was used to compare the probe intensity level between array of data set, end of the box represents upper and lower quartile, the line in the middle represent median, horizontal line indicated largest and smallest value outliers. Outliers are value that lie more than 1.5 times the interquartile range from the first and third quartile (edge of the box); the array box plot Figure 5A have intensity level is different from rest of the array they need to be corrected by normalization. Figure 5B indicates after normalization box plot, median lie on same line.
Figure 5A & 5B: 5A: Original expression value box plot.
5B: Normalize expression value box plot.
Principal Component Analysis (PCA)
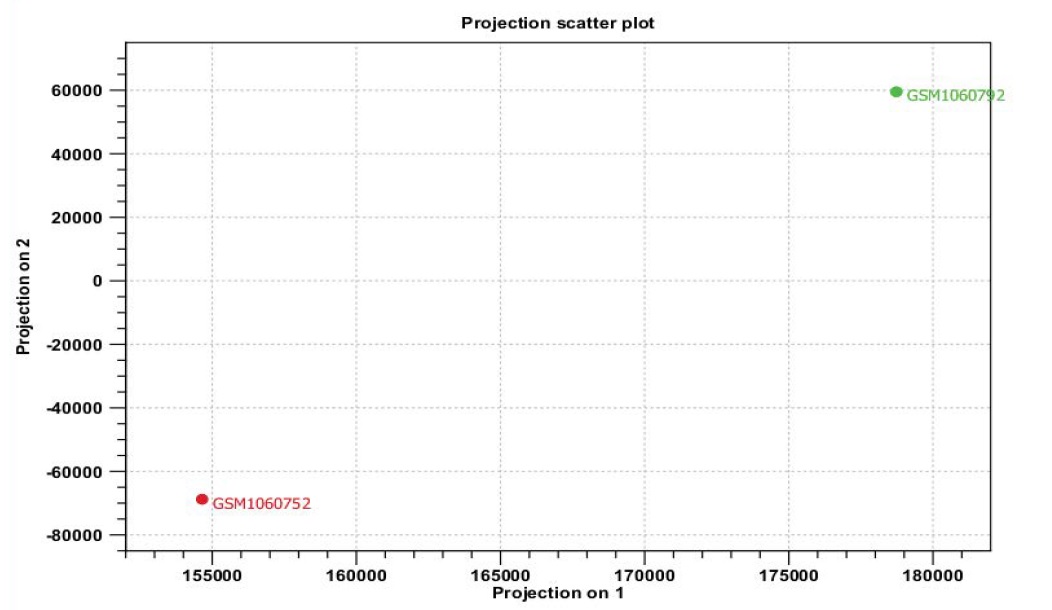
PCA performs a transformation of the data into “principal components”. Principal components are linear combinations of the original variables, in the present case the features are genes. Principal components are ranked in such a way that the first principal component is the linear combination of features that captures the direction of largest variation in the data set. In Figure 6 both principal component shows are an axis in space, so can project each sample on this axis and the variance between the projected samples will be the maximum among all possible choices of the first axis. The second principal component is another axis in space, perpendicular to the first. Projecting the samples on two axes generates the plot in which the variation between the samples is as large as possible Figure 6.
Figure 6: PCA indicates variation between expressed genes of normal and lung cancer microarray data. It will be maximum among all possible choice of the first axis.
K-Means Clustering Analysis
K-means clustering assigns each point to the cluster whose center is nearest. The center of a cluster is defined as the average of all points in the cluster. If a data set has three dimensions and the cluster has two points X = (x1; x2; x3) and Y = (y1; y2; y3), then the centroid Z becomes Z = (z1; z2; z3), where zi = (xi + yi) =2 for i = 1; 2; 3.
The algorithm attempts to minimize the Intra-cluster variance defined by:
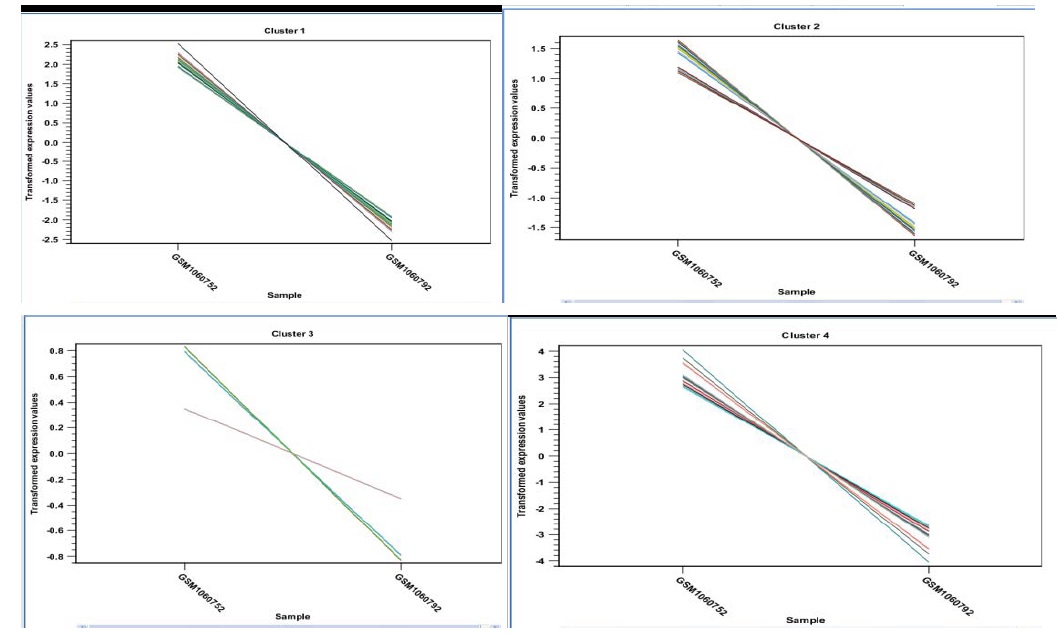
Where there is k clusters Sj; j = 1; 2; ….; k and j are the centroid of all points xn 2 Si [31]. The result of the clustering is several graphs. The number depends on the number of partitions chosen Figure 7 there is one graph per cluster. Expression levels for each cluster have a distinct pattern which select the feature of this cluster in a volcano or scatter plot. which will lead to improvement in accuracy and will reduce clustering time by the member assigned to the cluster are used to get better results in the form of finding distance to have exact centroid and to remove noise data which is not needed.
Figure 7: Representatives of expression patterns of the differentially expressed genes (DEGs) by K-means clustering analysis in normal lung cell (GSM1060752), and cancerous lung cell (GSM1060792). All images indicate the expression level of each cluster that have distinct pattern moreover closer look at the features represented in each cluster that describe volcano or scatter plot.
Volcano Plot
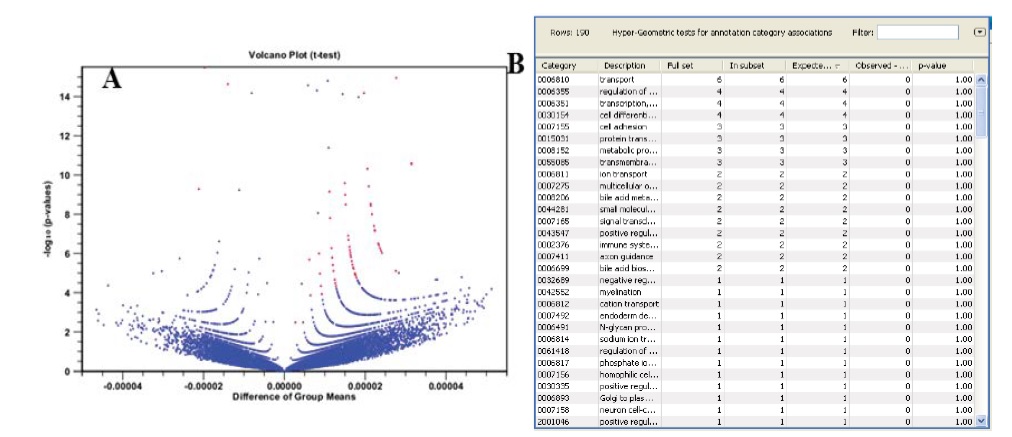
One-way analysis of variance (ANNOVA) with the time course data resulted that out of 54674 gene, 72 gene wears differentially expressed having p value <0.0005, and fold change (difference) >1 Figure 8A [32]. The filtered data was processed for gene annotation Figure 8B [33]. Out of which the first two listed proteins GLUT1 and hexokinase 2 were selected for docking with MJ.
Figure 8A & 8B: 8A: Volcano plot showing differentially expressed genes with fold-change ≥ 1 and karl’s z-test FDR P-value≤ 0.0005 (72 genes) as red spots.
8B: Screen shot of annotation file downloaded from HG-U133 platform utilized to indicate annotation to the filtered microarray data.
Results of volcano plot indicate that the transport proteins are highly differentially expressed protein in lung cancer cell Figure 8B. Import an annotation file used to annotate the arrays by downloading microarray data originally produced using an Affymetrix chip. The annotation file is downloaded from the Affymetrix web site (http://www.affymetrix.com/ support/technical/annotationfilesmain.affx). Name of the annotation file was HG-U133 available in the GEO record of the data set in NCBI.
Docking of MJ with Target Protein
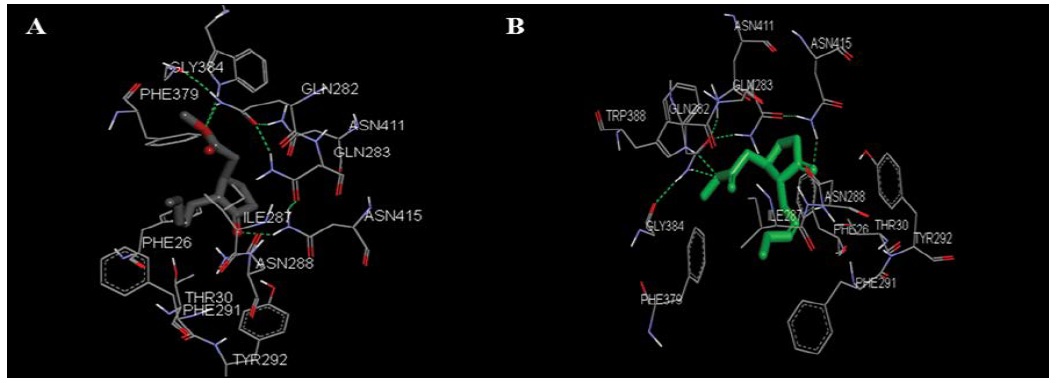
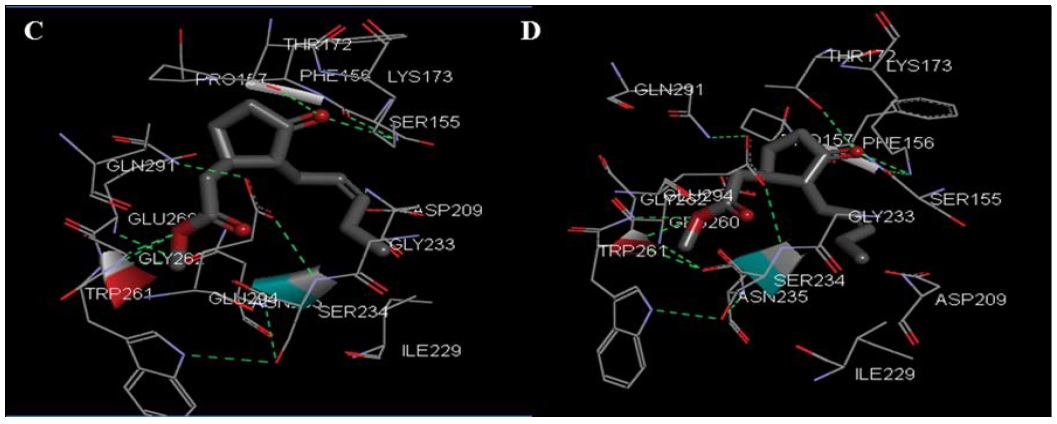
Comparative docking was carried out in discovery studio on the ligand binding site with grid radious of 10Å. MJ binds with negative binding energy in lung cancer cell transport protein GLUT1 (PDB id 4PYP) Figure 9A, B and hexokinase 2 (PDB id 2NZT) Figure 9C, D [34].
Figure 9A & 9B: are showing different orientations of transport protein GLUT1 docked with MJ in lung cancer cell. A and B are indicating five probable binding sites with green doted lines are Trp 388, Gly 384, Thr 30, Tyr 292, Gln 282 located in A and B.
In silico amino acids involve in binding were observed with the MJ analogue named β-non glucoside (BNG 601(A)) with estimated free energy for binding was -5.72kcal/mol GLUT1. BNG binds with GLUT1 by three probable binding sites having amino acids Asn 288(A), Asn 317(A), Glu 380(A). Whereas MJ binds with the five probable binding sites Trp 388, Gly 384, Thr 30, Tyr 292 and Gln 282 Figure 9A, B of GLUT1 with estimated free energy of binding was -4.91 kcal/mol. The values were derived at the 5th run out of 10 conformations in the structure. This suggests strong interaction of MJ than its analogue BNG with GLUT1.
MJ binds to the hexokinase-II targeted protein Figure 9C, D with estimated free energy of binding was +13.69 kcal/ mol. Value was derived at the 9th run out of 10 confirmations in the structure. MJ binds with HK-II with two hydrogen bonds indicated as red and blue rhomboidal shapes in Figure 9C, D. Interactions happened between LYS173 of HK-II chain A, with oxygen of MJ. MJ binds with Pro 157, Ser 155, Thr172, Gly 233, Ser 234, Gly 262 and Trp 261 seven residue of HK-II.
Figure 9C & 9D: is showing docking of MJ with transferase protein hexokinase 2 indicate interaction with seven amino acids (Pro 157, Ser 155, Thr172, Gly 233, Ser 234, Gly 262, Trp 261), with additional two hydrogen bond between LYS(A) 173 on HK-II chain with oxygen of ligand MJ.
Discussion
In the current study, we have established therapeutic potential of MJ to attenuate the proliferation of human lung cancer A-549 cells. Similar approach however with fruit extract of blackberries (Rubus sp.) treated with MJ (0.01 and 0.1 mM) enhanced inhibition of A549 cells and HL-60 cells proliferation and induced the apoptosis of HL-60 cells [5]. MJ has proven mechanism of action on different cancer cell lines [8] with the report of Environmental Protection Agency (EPA) indicating none of the toxicity on normal cells even through any route of entry in the body [7].
Microarray data analysis annotated by the differential gene expression indicates that transport family of protein is highly differentially expressed in SCLC lung cancer cells, out of which mitochondrial hexokinase II (HK2) and Glucose transporter 1 (GLUT 1) of glucose channel are potential targets for cancer therapy. Cells need nutrition for survival and glucose is a primary nutrition for all type of cells. Transportation of glucose is mediated by glucose channel, and therefore glucose is actively taken by non-oxygenated cells of SCLC by GLUT-1 [35,36]. Enzyme HK2 produces glucose 6-phosphate from cytoplasmic glucose and mitochondrial ATP. Voltage dependent anion channel (VDAC) transport ADP and inorganic phosphate from cytoplasm to construct ATP in mitochondria and again transport ATP from mitochondria to cytoplasm. This facilitates availability of ATP to HK2. This increases affinity of HK2 to glucose, ATP and VDAC leads advantage of cancer cell survival called Warburg effect [8,37]. This enhances anaerobic glucose metabolism and produce lactate, increases “tumor acidosis” more suitable of colonization, invasion of tumor cell [38]. HK2 is binding 200- fold tightly to the N-terminus hydrophobic region of VDAC [39], this association protects tumor cell from mitochondrial outer membrane permiabilize (MOMP) leading to cell death [40].
Cancer cells are generally more “famished” of nutrients than normal cells to protract their high proliferative rates. This is shown by, higher consumption of glucose and due to anaerobic glycolysis, lead to accumulation of lactate and the active secretion of lactic acid outside the tumor cells significantly contributes to the acidification of the extracellular milieu, and it promotes tumor acidosis [41]. This renders the environment around tumor tissues more suitable for colonization and invasion by cancer cells. Moreover, lactate also actively stimulates tumor cell migration, by activation of β1-integrins, and angiogenesis, following a stimulation of vascular endothelial growth factor (VEGF) production in endothelial cells increased extracellular acidosis [42]. The entrance of glucose inside the cell occurs by facilitated diffusion and is mainly dependent on GLUT-1. In addition to the up regulation of expression, the activity of GLUT-1 in tumors is 10–12 folds higher than that in healthy cells [43]. In this case MJ binds central channel of GLUT-1 which is vital for glucose transport by interacting with five amino acid residues. This will terminate glucose transfer in targeted cell leads to hypoxic condition resulted into nacrosis death of the cancer cells.
Hexokinase (HK) has four isoforms and it is potential target for cancer therapy, among them HK2 isoform is highly expressed, in tumor cells by oxidative glycolysis, and it’s called as the Warburg effect [38]. HK2 interacts with glucose, ATP and VDAC [40]. To produce glucose 6-phosphet from cytoplasmic glucose and mitochondrial ATP. VDAC lies at a crucial position in the cell, forming the main interface between the mitochondrial and cellular metabolisms. VDAC constitutes a major pathway by which metabolites, such as NAD+/ NADH, ADP/ATP, succinate, citrate, and ions, such as Ca++, are exchanged, VDAC1 acts as a gatekeeper for the entry and exit of mitochondrial metabolites, thus controlling the cross-talk between mitochondria and the cytosol. Although VDAC plays a major role in the physiological processes of solute and metabolite transport, it is also recognized as a key protein in mitochondria-mediated apoptosis [44].
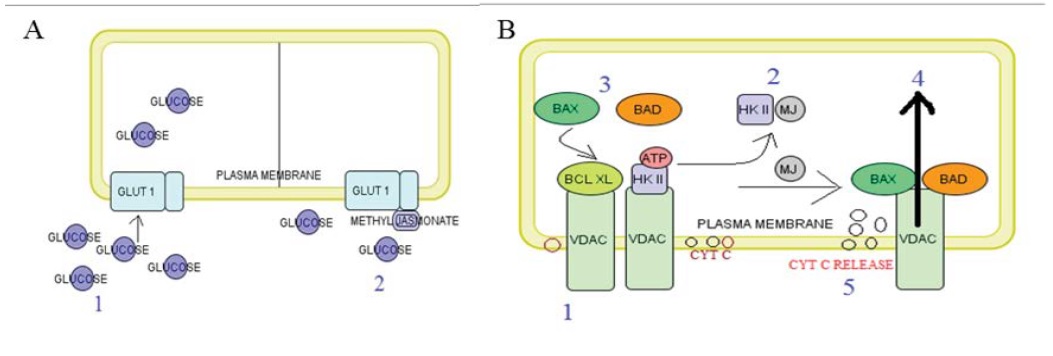
The overall mechanism of MJ is summarized in Figure 10. In our case MJ is to be tightly binding of HK-2 and it interfere the active site of ATP in HK2 and overlapping the adenosine ring of ATP nucleotide, leads to ATP depletion in cancerous cell. HK2 bind to the VDAC pore hydrophobic region in the outer mitochondrial membranes (OMM), and form HK/VDAC complex in cancer cells [37]. MJ has induced HK detachment from its VDAC anchor because MJ reserved ATP binding site in HK2. When this happen, the Bax/Bcl-xl balance is altered, antiapoptotic Bcl-xl proteins are released from the OMM, and proapoptotic proteins occupy their sites inducing the intrinsic way of apoptosis occurred [45].
Figure 10A and B: Schematic diagrams explaining two subsequent mechanism of MJ with GLUT1 and HKII on cancerous cell line.
Figure 10 A Step 1 showing uniport transport protein GLUT 1 facilitates transport glucose to cytosol. Step 2, when MJ bind with the central channel of GLUT 1 and interfering facilitate glucose transportation. OMM: Outer Mitochondrial Membrane, IMM: Inner Mitochondrial Membrane, IMS: Inner Mitochondrial Space ECS: Extra Cellular Space. Figure 10 B Step 1 Showing Warburg effect including HK-II bind with VDAC and increase cancerous cell metabolism. Step 2 MJ occupied binding site on HK II and it’s not able to bind VDAC channel. Step 3, antiapoptotic Bcl-xl replace by proapoptotic Bax, Bad kept on VDAC. Step 4, HK-II not able to bind with VDAC because of proapoptotic molecules already reserved this place. Step 5, proapoptotic molecules responsible for releasing cytochrome c to its binding from cardiolipin in inner mitochondrial membrane to the inner mitochondrial space and it leads to apoptosis of the cell due to generate oxidative stress in cell or responsible for fragmentation of DNA.
Conclusion
MJ has potential values as a novel therapeutic approach for lung cancer having 4.937mM and 7.822mM IC50 and IC90 values on A-549 lung cancer cell line respectively. MJ directly bind GLUT1 and block glucose uptake in high glycolytic tumor cell, GLUT-1 is vital for glucose transport. Docking of MJ bind central channel of GLUT-1 with five residues named Trp 388, Gly 384, Thr 30, Tyr 292, Gln 282. Additional involvement of MJ is detaching HK2 from VDAC. Structure of MJ can be further modified through in silico modeling according to the binding energy to create more accurate targeted drug. The present results indicate further investigation into the mechanisms of MJ mediated anticancer activity.
Ferlay J, Shin HR, Bray F, Forman D, Mathers C, et al. (2010) Estimates of worldwide burden of cancer in 2008: GLOBOCAN 2008. Int J Cancer. 127: 2893-2917. [ Ref ]
Parkin M, Bray F, Ferlay J, Pisani P (2005) Global Cancer Statistics, 2002. CA Cancer J Clin. 55: 74-108. [ Ref ]
Inazua M, Yamada T, Kubota N, Yamanaka T (2013) Functional expression of choline transporter-like protein 1 (CTL1) in small cell lung carcinoma cells : a target molecule for lung cancer therapy. Pharmacological Research. 76: 119-131. [ Ref ]
NCI (2013) National cancer institute at the national institute of health, [www.cancer.gov/cancertopics/factsheet/therapy/radiation]. 21,2013. [ Ref ]
Wang SY, Bowman L, Ding M (2008) Methyl jasmonate enhances antioxidant activity and flavonoid content in blackberries (Rubus sp.) and promotes antiproliferation of human cancer cells. Food Chemistry. 107: 1261-1269. [ Ref ]
Reischer D, Heyfets A, Shimony S, Nordenberg J, Kashman Y, et al. (2009) Effects of natural and novel synthetic jasmonates in experimental metastatic melanoma. British Journal of Pharmacology. 150: 738-749. [ Ref ]
Environmental Protection Agency (EPA) (2013 ) Methyl Jasmonate: exemption from the requirement of a tolerance. Federal Register. 78: 22789-22794. [ Ref ]
Cesari I, Rodrigues M, Mendonca B, Amoedo N, Rumjanek F, et al. (2014) Methyl Jasmonate: Putative Mechanisms of Action on cancer cells cycle metabolism and apoptosis. International Journal of Cell Biology. 30: 1-25. [ Ref ]
Zheng L, Li D, Xiang X, Tong L, Qi M, et al. (2013) Methyl jasmonate abolishes the migration, invasion and angiogenesis of gastric cancer cells through down-regulation of matrix metalloproteinase 14. BMC Cancer. 10: 13-74. [ Ref ]
Zheng L, Jiang G, Mei H, Pu J, Dong J, et al. (2010) Small RNA interferencemediated gene silencing of heparanase abolishes the invasion, metastasis and angiogenesis of gastric cancer cells. BMC Cancer. 10: 33. [ Ref ]
Terry L, Moravec A, Niles L, Sarah D, Hélène A, et al. (2004) Use of Multiple Assay Endpoints to Investigate the Effects of Incubation Time, Dose of Toxin, and Plating Density in Cell-Based Cytotoxicity Assays. Assay and drug development technologies. 2 : 51-62. [ Ref ]
Conesa A, Gotz S, Garcia-Gomez JM, Terol J, Talon M, et al. (2005) Blast2GO: a universal tool for annotation, visualization and analysis in functional genomics research. Bioinformatics. 21: 3674-3676. [ Ref ]
Baggerly K, Deng L, Morris J, Aldaz C (2003) Differen-tial expression in SAGE: accounting for normal between-library variation. Bioinformatics. 19: 1477-1483. [ Ref ]
Tusher VG, Tibshirani R, Chu G (2001) Significance analysis of microarrays applied to the ionizing radiation response. Proc Natl Acad Sci USA. 98: 5116-5121. [ Ref ]
Guo L, Lobenhofer EK, Wang C, Shippy R, Harris C, et al. (2006) Rat toxicogenomic study reveals analytical consistency across microarray platforms. Nat Biotechnol. 24: 1162-1169. [ Ref ]
Nielsen KL (2007) Serial Analysis of Gene Expression (SAGE): Methods and Protocols. Humana Press. [ Ref ]
Hoen C, Ariyurek Y, Thygesen H, Vreugdenhil E, Vosse R, et al. (2008) Deep sequencing-based expression analysis shows major advances in robustness, resolution and inter-lab portability over five microarray platforms. Nucleic Acids Res. 36: 141-148. [ Ref ]
Parkhomchuk D, Borodina T, Amstislavskiy V, Banaru M, Hallen L, et al. (2009) Transcriptome analysis by strand-specific sequencing of complementary DNA. Nucleic Acids Res. 18: 123-130. [ Ref ]
Eisen M, Spellman P, Brown P, Botstein D (1998) Cluster analysis and display of genome-wide expression patterns. Proceedings of the National Academy of Sciences. 95: 14863-14868. [ Ref ]
Bolstad B, Irizarry R, Astrand M, Speed T (2003) A comparison of normalization methods for high density oligonucleotide array data based on variance and bias. Bioinformatics. 19: 185-193. [ Ref ]
Allison DB, Cui X, Page GP, Sabripour M (2006) Microarray data analysis: from disarray to consolidation and consensus. Nature reviews genetics. 7: 55-65. [ Ref ]
Babu MM, Luscombe N, Aravind L, Gerstein M, Teichmann A (2004) Structure and evolution of transcriptional regulatory networks. Current Opinion on Structural Biology. 14: 283-291. [ Ref ]
Quackenbush J (2002) Microarray data normalization and transformation. Nat. Genet. 32: 496-501. [ Ref ]
Kal J, van Zonneveld J, Benes V, van den Berg M, Koerkamp G, et al. (1999) Dynamics of gene expression revealed by comparison of serial analysis of gene expression transcript profiles from yeast grown on two different carbon sources. Molecular Biology of the Cell. 10: 1685-2100. [ Ref ]
Falcon S and Gentleman R (2007) Using GOstats to test gene, lists for GO term association. Bioinformatics. 23: 257-258. [ Ref ]
Morris M, Goodsell S, Huey R, Olson J (1996) Distributed automated docking of flexible ligands to proteins: Parallel applications of AutoDock 2.4 J. Computer-Aided Molecular Design. 10: 293-304. [ Ref ]
Fierce Biotech (2012) ChemAxon opens shop in ‘heart’ of Boston biotech hub, [www.fiercebiotech.com/r-d/chemaxon-opens-shop-heart-ofboston- biotech-hub]. May 2015. [ Ref ]
ChemAxon (2004) Chemaxon Announces Free Software for the Academic Community Via the Jchem and Marvin Academic Package. 2015. [ Ref ]
Eswar N, Marti-Renom A, Webb B, Madhusudhan M.S, Eramian D, et al. (2006) Comparative Protein Structure Modeling With MODELLER. Current Protocols in Bioinformatics, John Wiley & Sons, Inc. 15: 5.6.1- 5.6.30. [ Ref ]
Sato T, Kaneda A, Tsuji S, Isagava T, Yamamoto S, et al. (2013) PRC2 overexpression and PRC2-target gene repression relating to poorer prognosis in small cell lung cancer. Scientific reports. 3 : 1911. [ Ref ]
Lloyd S (1982) Least squares quantization in PCM. IEEE Transactions on Information Theory. 28: 129-137. [ Ref ]
Benjamini Y and Hochberg Y (1995) Controlling the false discovery rate: a practical and powerful approach to multiple testing. journal-royal statastical society series B. 57: 289-300. [ Ref ]
Tian L, Greenberg S, Kong S, Altschuler J, Kohane I, et al. (2005) Discovering statistically significant pathways in expression profiling studies. Proceedings of the National Academy of Sciences. 102: 13544- 13549. [ Ref ]
Deng D, Xu C, Sun P, WU J, Yan C, et al. (2014) Crystal structure of the human glucose transporter GLUT1. Nature. 510: 121-125. [ Ref ]
Granchi C and Minutolo F (2012) Anticancer Agents That Counteract Tumor Glycolysis. ChemMedChem. 7: 1318-1350. [ Ref ]
Minjong Lee and Yoon JH (2015) Metabolic interplay between glycolysis and mitochondrial oxidation: the reverse warburg effect and its theraputic implication. World Journal of Biological Chemistery. 6: 148- 161. [ Ref ]
Goldin N, Arzoine L, Heyfets A, Israelson A, Zaslavsky Z, et al. (2008) Methyl jasmonate binds to and detaches mitochondria-bound hexokinase. Oncogene. 27: 4636–4643. [ Ref ]
Cerella C, Flavia R, Mario D, Marc D (2013) Natural Compounds as Regulators of the Cancer cell metabolosam. Hindawi Publishing Corporation international jurnal of cell biology. [ Ref ]
Barmatz S, Israelson A, Brdiczka D, Sheu SS (2006) The voltagedependent anion chennel (VDAC): function in intracellular signalling, cell life and cell death. current pharmaceutical design. 12: 2249-2270. [ Ref ]
Galluzzi L, Kepp O, Tajeddine N, Kroemer G (2008) Disruption of the hexokinase-VDAC complex for tumor therapy. Oncogene. 27: 4633- 4635. [ Ref ]
Chiche J, Christiane M, Pouysségur J (2010) Tumour hypoxia induces a metabolic shift causing acidosis: a common feature in cancer. Journal of Cell and Molecular Medicine. 14: 771-794. [ Ref ]
Marchiq I and Pouysségur J (2016) Hypoxia, cancer metabolism and the therapeutic benefit of targeting lactate/H+ symporters. Journal of Molecular Medicine. 94: 155-171. [ Ref ]
Medina R and Owen G (2002) Glucose transporters: expression, regulation and cancer. Biological Research Santiago. 35: 9-26. [ Ref ]
Shoshan-Barmatz V, Zakir M, Rosenthal K, Hamad S (2009) Key regions of VDAC1 functioning in apoptosis induction and regulation by hexokinase: Biochimica et Biophysica Acta. 1787: 421-430. [ Ref ]
Kim H, Lee S Y, Oh S Y, Han S L, Park H G, et al. (2004) Methyl jasmonate induces apoptosis through induction of Bax/Bcl-XS and activation of caspase-3 via ROS production in A549 cells. Oncology Reports. 12: 1233- 1238. [ Ref ]
