Journal Name: International Journal of Cancer and Treatment
Article Type: Research
Received date: 12 March, 2019
Accepted date: 18 March, 2019
Published date: 31 March, 2019
Citation: Zahrani KA, Judaibi EA, Khayyat SA, Galal K, Alrashedi M, et al (2019) Influence of Chemotherapy Treatment on Escherichia coli. Int J Cancer Tremnt Vol: 2, Issu: 1 (07-17).
Copyright: © 2019 Zahrani KA, et al. This is an openaccess article distributed under the terms of the Creative Commons Attribution License, which permits unrestricted use, distribution, and reproduction in any medium, provided the original author and source are credited.
Abstract
The microbiome in the human intestinal tract develops over time, eventually providing benefits to the individual. These benefits involve improved immunity, including providing resistance against pathogenic microorganisms, as well as participation of the microbiota in disposal of gastrointestinal waste and regulation of metabolism during development. Consequently, the effects of chemotherapy on the intestinal microflora may have implications on the health of patients with cancer. In this study, we evaluated the effects of chemotherapy on Escherichia coli as an indicator species for Enterobacteriaceae activity before and after chemotherapy treatment. We isolated E. coli from fecal samples of patients with cancer before and after chemotherapy treatment. Among 20 patients, three had E. coli in their fecal samples before and after chemotherapy treatment. The bacteria were identified by extracted DNA, and changes were examined in terms of biochemical activity, including the production of acids and gas, as well as the leakage of potassium, phosphorus, sodium, and chloride into the medium. We evaluated cell morphology by scanning electron microscopy, and the genome of E. coli was sequenced by r16S. The results showed damage to the cells after treatment, particularly production of gas and acids and leakage of phosphorus, potassium, sodium, and chloride before and after treatment. Overall, our findings showed that chemotherapy had a clear effect on the intestinal bacteria.
Keywords
gut microbiota, Escherichia coli, chemotherapy, molecular identification.
Introduction
Recent studies have demonstrated that the microbiome of the gut has profound effects on health. Most gut microbes benefit the host by protecting against enteropathogens and contributing to normal immune function. In addition, they extract nutrients and energy from foods, synthesize essential vitamins and amino acids, and help degrade toxins. Beginning at birth, the human body harbors microorganisms, with the number increasing until adulthood; in adults, the microbial cells comprising the microflora are greater in number than human cells in the body [1-4[. One of the most important human microflora is the microorganisms inhabit the human intestine, called the microbiota. The balance of the gut microbiota in the host is associated with cancer, neurological disorders, inflammatory diseases, bowel diseases, obesity, and malnutrition [5-6]. Studies of the gut microbiota in mice have demonstrated that the microbiota boosts monosaccharide absorption from the lumen [5,7-9], highlighting the importance of these organisms.
The colon microbiota modulates the digestion of some organic compounds from the diet. Notably, however, consumption of probiotics and prebiotics in the diet can modify the structure and metabolic activities of the microbiota [9-11]. Food supplements as probiotics include yoghurts and dairy products containing Bifidobacteria; this gram-positive bacilli-like bacterium is nonpathogenic, nongenotoxic, and nondigestible and shows advantages associated with the ability to stimulate cell growth or activity. Moreover, Lactobacilli and Bifidobacteria have been shown to improve the health of the colon [12]. Indeed, the probiotic microbiota colonizing the gastrointestinal tract has metabolic functions that support gastrointestinal health in humans and may be relevant for host physiology [13].
Escherichia coli is the most common facultative species isolated from the feces of all healthy neonates [14]. Culturebased studies have suggested that all healthy adults share common gut bacterial species as the core microbiota. For example, E. coli can be isolated from most people [6]. However, the intestinal microflora can be altered by many endogenous and exogenous factors, including feeding, age, sex, habits, physiological functions, immune mechanisms, endogenous microorganisms, diets, drugs, and emotional stress [15-18].
Similarly, chemotherapy and antibiotics are associated with severe side effects, such as mucositis, diarrhea, and constipation. These side effects increase the cost of health services and are often life-threatening. Antibiotic and chemotherapy treatments for patients with cancer can also affect the intestinal microbiota, which can alter the intestinal mucosa and increase the risk of infection by Clostridium difficile, resulting in inflammatory complications [19-23]. In other studies, the use of cancer chemotherapies plus antibiotics has been shown to disrupt the fecal microbial ecosystem, resulting in decreased species richness immediately after administration of the chemotherapy [23- 25]. Changes in the fecal microbiota caused by chemotherapy are related to systemic effects and can promote the development of chemotherapy-induced mucositis, which affects the microbial ecosystem [26].
In this study, we investigated the effects of chemotherapy in patients with cancer on E. coli activity, including potassium, phosphorus, sodium, and chloride leakage as well as acid and gas production. Moreover, we studied the effects of chemotherapy on bacterial characteristics, including cell wall morphology and molecular features.
Materials and Methods
Ethical approval
The Ethics Committee of King Abdulaziz University Hospital and Dr. Erfan and Bagedo General Hospital approved the study protocols (approval nos. D/37/62998 on 24/2/2016 and 011016 on 17/11/2016).
Isolation and identification of E. coli in patients with cancer
Stool samples were collected from patients with cancer 1 week before and after chemotherapy, and 10 μL from each sample was inoculated in selenite broth and incubated for 24 h at 37°C under aerobic conditions before purification. One microliter was streaked on blood agar and incubated for 24 h at 37°C. Samples were alternatively streaked on MacConkey agar, blood agar, and chocolate agar and incubated for 24 h at 37°C. Each test was performed in triplicate. Combination panels (NMIC/ID-26; catalog no. 448026) were used for identification. Bacterial colonies from a pure culture were adjusted to a 0.5 McFarland standard using a CrystalSpec nephelometer (BD Diagnostics, Sparks MD, USA), according to the manufacturer’s recommendations. A 25-μL aliquot of the suspension was poured to determine the ID side of the Phoenix panel. The specimen was logged and loaded into the instrument within the specified timeline of 30 min. The time needed to obtain a complete set of ID results varied between 8 and 12 h [27]. Identification of the bacteria was performed at Maternity & Children’s Hospital in Jeddah, Saudi Arabia.
Determination of potassium, phosphorus, sodium, and chloride leakage
The secondary metabolism of the bacteria was estimated by computing proportions of potassium, phosphorus, sodium, and chloride in the medium. Potassium, phosphorus, sodium, and chloride ion effluxes were determined according to a previously described method [28-29]. The concentrations of free potassium, phosphorus, sodium, and chloride ions in the bacterial suspension of E. coli were measured after exposure of bacterial cells to nutrient broth for 30, 60, 120, 240, 480, or 720 min. The mixture was incubated at 37°C. Three replicates were performed for each tube. At each pre-established interval, the extracellular potassium, phosphorus, sodium, and chloride concentrations were measured using photometric procedures (EasyRA Medica for potassium and COBAS INTEGRA 400 plus for phosphorus). The results were expressed as the amount of extracellular free potassium, phosphorus, sodium, or chloride ions in the growth medium (mM) during each incubation interval. Each treatment was performed in triplicate.
Gas and acid production
Next, we compared the ability of E. coli to produce acids and gas before and after chemotherapy. MacConkey broth in Durham tubes was inoculated with 10 μL of 24-h E. coli suspensions, and tubes were then incubated at 37°C for 24 h. Visible gas production in Durham tubes was recorded, and acids were evaluated using a EUTECH Instruments pH 700 (Thermo Scientific) [30]. Each culture was evaluated in triplicate.
Scanning electron microscopy (SEM)
In order to assess the morphological characteristics of isolated E. coli before and after chemotherapy, SEM was performed. E. coli cells were selected to carry out this experiment. Bacteria were incubated for 24 h in nutrient broth [31]. The cultures were incubated at 37°C and then centrifuged to separate the bacteria cells at 9,800 x g. A thin film of E. coli cells was smeared on a copper stub, and the samples were coated with Polaron gold by cathodic spraying and then dried under a mercury lamp for 5 min. The morphologies of E. coli cells were observed with a scanning electronic microscope (JEOL model JSM-7600F) [32-33]. Samples were scanned in the Nano Center at King Abudlaziz University.
Molecular characterization and identification
The isolated bacterial DNA was extracted using a Qiagen DNA extract kit [34]. For genomic DNA isolation, 10 μL cells suspension from a bacterial colony grown overnight on an agar plate at 37°C was transferred to a 1.5-mL Eppendorf tube. Bacterial DNA was extracted using a Qiagen DNA kit with a special protocol for each type of bacteria. For gramnegative bacteria, a resuspended pellet was placed in 180 μL A Tissue Lysis buffer and 20 μL proteinase K was added. The samples were then mixed thoroughly by vortexing and incubated at 56°C until the tissue completely lysed. The samples were mixed by vortexing for 15 s, and 200 μL buffer was added. Samples were again mixed by vortexing, 200 μL ethanol (96–100%) was added, and the samples were mixed by vortexing. The mixture was pipetted into DNeasy Mini spin columns and placed in a 2-mL collection tube. The samples were then centrifuged at 8,000 rpm for 1 min. The DNeasy Mini spin columns were placed in a new 2-mL collection tube, 500 μL buffer AW1 was added, and the samples were centrifuged for 1 min at 8,000 rpm. The DNeasy Mini spin columns were placed in new 2-mL collection tubes, 500 μL of buffer AW2 was added, and the mixtures were centrifuged for 3 min at 14,000 rpm. The DNeasy Mini spin columns were then placed in clean 2-mL microcentrifuge tubes, and 200 μL buffer AE was pipetted directly onto the DNeasy membrane. Samples were then incubated at room temperature for 1 min and centrifuged for 1 min at 8,000 rpm to elute the DNA. The isolated DNA samples were stored at -20°C according to the manufacturer’s protocol, as outlined in the DNeasy Blood and Tissue Handbook [35].
For agarose gel electrophoresis, the DNA samples were prepared by mixing with 6× loading buffer (5:1) and placed into the wells. Three microliters of the DNA ladder was also electrophoresed. Electrophoresis (SCIEPLAS UK) was performed using a Thermo ECEC135-90 Electrophoresis Power Supply (Thermo Electron, USA) with the following settings: 130 V, 100 Amp, approximately 1.3 h. The migration distance of the DNA in the gel was judged by visually monitoring the migration of the tracking dye.
The DNA bands were visualized under UV light based on ethidium bromide staining. The 16S gene was amplified by polymerase chain reaction using the following forward and reverse primers: 518F 5′-CCAGCAGCCGCGGTAATACG-3′ and 800R 5′-TACCAGGGTATCTAATCC-3′. The primers for the amplification of the 16S gene were designed based on the conserved regions in the 518F and 800R genome sequences [36]. The extracted DNA was sequenced by Macrogen (https://www.macrogenusa.com/). The sequenced data were analyzed by BLAST-NCBI (http://blast.ncbi.nlm.nih. gov/Blast.cgi).
Statistical analysis
Data for the microbial inhibition zone and cell counts (CFU/mL) were collected, summarized, and tabulated. Statistical analyses were performed using the Statistical Package for Social Science (SPSS for Windows, version 16; SPSS Inc., Chicago, IL, USA). The variability of the results was expressed as means ± standard deviations. The significance of the differences between samples and the homogeneity between groups were determined using analysis of variance. Results with P values of less than 0.05 were considered significant.
References
The References are in APA format, and they were performed by using EndNote Thomson Reuters software version X7.
Results
Biochemical interactions of E. coli isolated from fecal samples from patients with cancer 1 week before and after chemotherapy
This experiment was designed to detect the interactions of the biochemical activities of E. coli isolated 1 week before and after the chemotherapy. The results are shown in Tables 1–4.
Table 1: Phosphorus leakage (μmol/ml) of Escherichia coli isolates.
| Incubation time (h)a | |||||||
|---|---|---|---|---|---|---|---|
| Samples | Treatments | 0.5 | 1 | 2 | 4 | 8 | 12 |
| 1 | Before | 0.75 ± 0.06 | 0.78 ± 0.08 | 0.83 ± 0.08 | 0.73 ± 0.03** | 0.72 ± 0.06* | 0.70 ± 0.05** |
| After | 0.75 ± 0.05* | 0.75 ± 0.03* | 0.70 ± 0.06 | 0.70 ± 0.09* | 0.70 ± 0.07** | 0.70 ± 0.05** | |
| 2 | Before | 0.60 ± 0.12* | 0.60 ± 0.04 | 0.60 ± 0.05 | 0.43 ± 0.06* | 0.40 ± 0.07* | 0.40 ± 0.04** |
| After | 0.50 ± 0.07 | 0.60 ± 0.03 | 0.50 ± 0.04 | 0.40 ± 0.03* | 0.44 ± 0.03** | 0.43 ± 0.05** | |
| 0.46 ± 0.06 | 0.37 ± 0.04 | 0.42 ± 0200 | 0.35 ± 0.11 | 0.37 ± 0.06** | 0.37 ± 0.04** | ||
*P ≤ 0.05
**P ≤ 0.01
aValues are mean ± SD.
Table 2: Potassium leakage (μmol/ml) of Escherichia coli isolates.
| Incubation time (h)a | |||||||
|---|---|---|---|---|---|---|---|
| Samples | Treatments | 0.5 | 1 | 2 | 4 | 8 | 12 |
| 1 | Before | 1.51 ± 0.03 | 1.50 ± 0.01 | 1.45 ± 0.01 | 1.50 ± 0.05** | 1.50 ± 0.02** | 1.52 ± 0.03** |
| After | 1.53 ± 0.06 | 1.51 ± 0.03 | 1.51 ± 0.02 | 1.54 ± 0.08 | 1.57 ± 0.05** | 1.50 ± 0.06** | |
| 2 | Before | 1.53 ± 0.03* | 1.54 ± 0.02 | 1.54 ± 0.06* | 1.45 ± 0.08 | 1.43 ± 0.05** | 1.50 ± 0.03** |
| After | 1.43 ± 0.02* | 1.48 ± 0.03* | 1.40 ± 0.02* | 1.49 ± 0.05* | 1.56 ± 0.05** | 1.43 ± 0.02** | |
| 1.22 ± 0.01* | 1.04 ± 0.03* | 1.11 ± 0.03* | 1.18 ± 0.11** | 1.16 ± 0.10** | 1.12 ± 0.04** | ||
*P ≤ 0.05
**P ≤ 0.01
aValues are mean ± SD.
Table 3: Sodium leakage (μmol/ml) of Escherichia coli isolates.
| Incubation time (h)a | |||||||
|---|---|---|---|---|---|---|---|
| Samples | Treatments | 0.5 | 1 | 2 | 4 | 8 | 12 |
| 1 | Before | 38.33 ± 2.1 | 39.00 ± 3.1 | 39.67 ± 2.5 | 40.00 ± 2.1 | 41.00 ± 1.2* | 41.00 ± 2.5 |
| After | 40.00 ± 1.5* | 40.00 ± 2.1* | 39.00 ± 2.5 | 39.00 ± 2.5 | 40.00 ± 2.1 | 40.00 ± 2.5 | |
| 2 | Before | 39.00 ± 2.5 | 38.00 ± 2.5 | 38.00 ± 3.1 | 33.00 ± 2.5* | 33.67 ± 1.5* | 35.67 ± 1.2* |
| After | 33.67 ± 0.6** | 35.00 ± 2.1* | 31.67 ± 2.5* | 33.67 ± 4.0* | 33.67 ± 1.2* | 34.33 ± 2.0* | |
| 25.33 ± 1.0** | 22.00 ± 2.9* | 24.33 ± 4.6* | 25.00 ± 1.2** | 25.00 ± 2.1** | 24.67 ± 0.6** | ||
*P ≤ 0.05
**P ≤ 0.01
aValues are mean ± SD.
Table 4: Chloride leakage (μmol/ml) of Escherichia coli isolates.
| Incubation time (h)a | |||||||
|---|---|---|---|---|---|---|---|
| Samples | Treatments | 0.5 | 1 | 2 | 4 | 8 | 12 |
| 1 | Before | 32.13 ± 0.4 | 31.93 ± 0.6 | 31.37 ± 1.0 | 32.30 ± 0.8 | 31.33 ± 0.4 | 32.40 ± 0.6 |
| After | 32.33 ± 0.6 | 32.20 ± 0.4 | 32.03 ± 0.4 | 32.37 ± 0.7 | 32.30 ± 0.3 | 32.23 ± 0.7 | |
| 2 | Before | 31.73 ± 0.3* | 31.67 ± 0.6* | 32,27 ± 0.1* | 27.90 ± 1.3* | 28.10 ± 0.8* | 28.63 ± 0.7* |
| After | 28.77 ± 0.5** | 27.20 ± 0.7** | 26.97 ± 0.1** | 28.20 ± 0.4** | 28.40 ± 0.4** | 27.17 ± 0.9** | |
| 29.60 ± 0.4** | 22.60 ± 0.1** | 22.60 ± 0.7** | 22.40 ± 0.7** | 21.37 ± 0.6** | 21.77 ± 0.5** | ||
*P ≤ 0.05
**P ≤ 0.01
aValues are mean ± SD.
Determination of potassium, phosphorus, sodium, and chloride leakage
As shown in Table 1, phosphorus leakage was observed after 1 h of incubation of E. coli isolates collected from a patient 1 week after chemotherapy treatment. Leakage then increased to 15.66% after 2 h and then decreased as the incubation time increased, reaching the value of that isolated one week before treatment by 12 h. The isolated strain showed various interactions between isolation before and after chemotherapy. Two trends were observed. First, some samples showed increased phosphorus leakage until 4 h, when the phosphorus leakage decreased to 6.98%. Phosphorus leakage then increased to 7.50% after 12 h. In contrast, the other strain showed decreased phosphorus leakage as the incubation time increased, reaching a value of 38.33% after 4 h and then decreasing until the end of incubation (7.50% at 12 h). These results were significant (P ≤ 0.01).
Potassium leakage values are shown in Table 2. Increased potassium leakage from E. coli culture isolated from a patient at 1 week before treatment compared with the isolated strain 1 week after treatment. As the incubation time increased, potassium leakage decreased to 1.32% by 12 h. The isolated strains of E. coli from a second patient showed different interactions of potassium leakage before and after chemotherapy. The first strain showed decreased potassium leakage as the incubation period increased, reaching 9.10% after 2 h of incubation. Potassium leakage then increased to 2.76% and 9.10% after 4 and 8 h, respectively, and then decreased to 4.67% after 12 h. In contrast, the second strain showed decreased potassium leakage throughout the incubation period, decreasing by 32.47% and 27.92% after 2 and 4 h, respectively. These results were highly significant (P ≤ 0.01).
Sodium leakage values are shown in Table 3. Sodium leakage between E. coli isolated from patients 1 and 2 and between strains before and after chemotherapy. For patient 1, sodium leakage increased after 1 h of incubation of E. coli after treatment compared with the same period of incubation of the strain before treatment, reaching 2.56% after 2 h of incubation until the end of incubation, and sodium leakage decreased further to 2.44% after 12 h of incubation. The results for patient 2 showed that sodium leakage decreased further after chemotherapy compared with that before chemotherapy; this decrease was different between the first and second strains isolated after chemotherapy, with the second strain showing a greater decrease than the first strain (7.89% and 42.11%, respectively, after 1 hour of incubation, and 3.76% and 30.84%, respectively, after 12 h of incubation). The interaction of the strains after 4 h of incubation varied, with the first strain increasing to 2.03% and the second strain decreasing to 24.24%. These results were highly significant (P ≤ 0.01).
Chloride leakage values are shown in Table 4. Chloride leakage from E. coli isolated from patient 1 increased until 8 h, reaching 3.10%, and then decreased to 0.53% after 12 h. The isolated E. coli from patient 2 showed a decrease in chloride leakage for both strains, except at 4 and 8 h for the first strain, which increased by 1.08% and 1.07%, respectively. The second strain showed a dramatic decrease by 29.97% after 2 h of incubation. These results were highly significant (P ≤ 0.01).
Gas and acid production
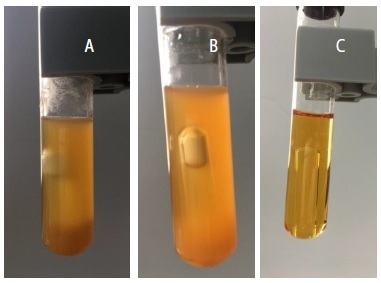
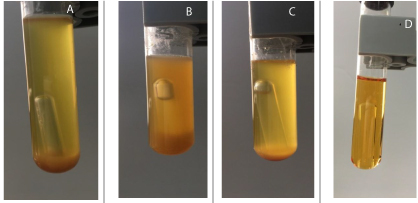
Gas and acid production values are shown in Table 5 and Figures 1 and 2. Notably, the strain isolated from patient 1 showed decreased gas production after chemotherapy, whereas the strains isolated from patient 2 showed no gas production for the first strain and increased gas production for the second strain. Moreover, acid production by E. coli decreased to 90.24% in patient 1 and 8.44% in the second strain of patient 2. These results were highly significant (P ≤ 0.01).
Table 5: Gas and acid production of Escherichia coli isolates.
| Treatments | Before | After | |||
|---|---|---|---|---|---|
| Samples | 1 | 2 | 1 | 2 | 2 |
| Gas | Medium | Low | Low | No gas | Medium |
| pH a | 1.030 ± 0.10** | 0.903 ± 0.041** | 0.960 ± 0.052** | 0.960 ± 0.058** | 0.879 ± 0.050** |
**P ≤ 0.01
Medium: Gas appears in half of Durham tube.
Low: Gas appears in quarter of Durham tube.
aValues are mean ± SD.
Figure 1: Biochemical activity by detecting acid and gas production of Escherishia coli isolates from fecal samples of patient 1 before (a) and after chemotherapy (b) compared to control (c).
Figure 2: Biochemical activity by detecting acid and gas production of Escherishia coli isolates from fecal samples of patient 2 before (a) and after chemotherapy(b) compared to control (C).
The biochemical interaction of E. coli strains on phosphorus, potassium, sodium, chloride leakage, and acid and gas production have equal interaction of biochemical activity before and after chemotherapy, except isolated strain from patient 1 have deferent anion and cation interaction.
Scanning electron microscopy (SEM)
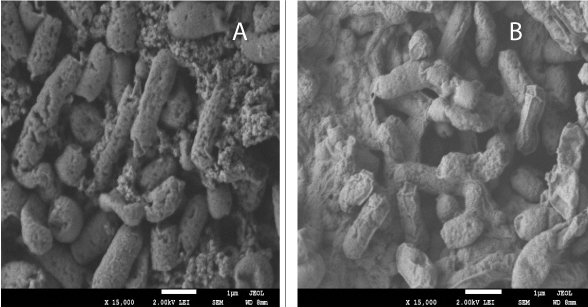
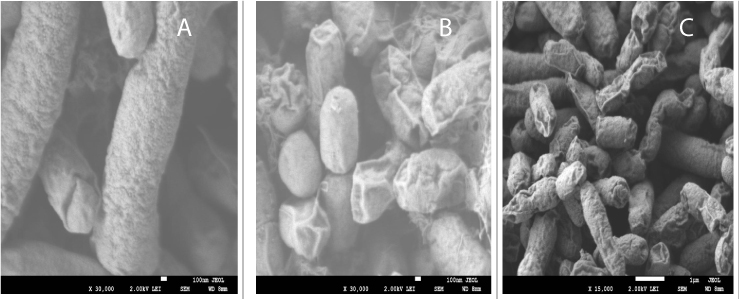
As shown in Figure 3, SEM of E. coli isolated from patient 1 revealed decreased polymer production after chemotherapy compared with that before chemotherapy. The cell surface was deformed and smooth. In contrast, as shown in Figure 4, SEM of E. coli isolated from patient 2 revealed greater cell wall damage, with cavities, shrinkage, aggregation, rupture, and deformation of the cell wall in both strains after chemotherapy compared with that before chemotherapy.
Figure 3: SEM of Escherishia coli isolate from fecal samples of patient 1 before (a) and after (b) chemotherapy.
Figure 4: SEM of Escherishia coli isolate from fecal samples of patient 2 before (a) and after (b) chemotherapy.
Molecular characterization and identification
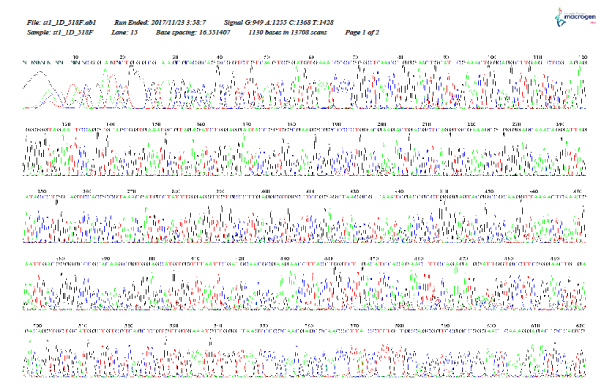
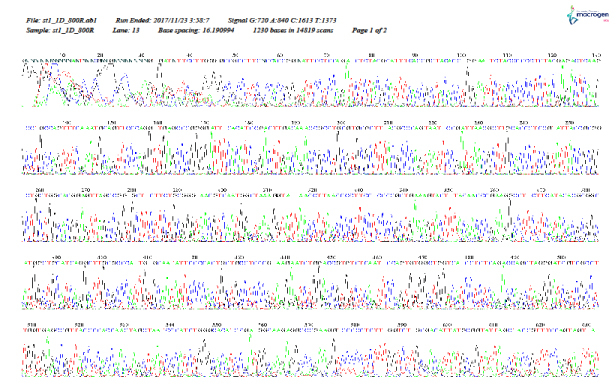
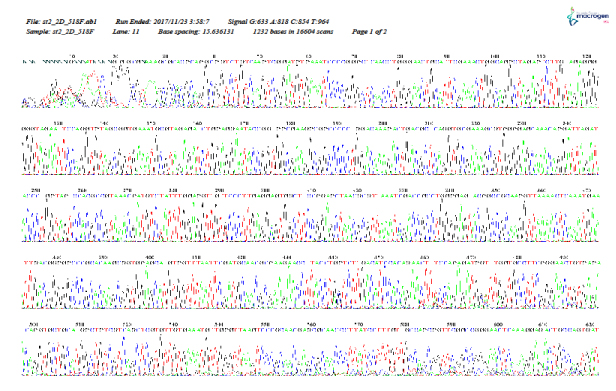
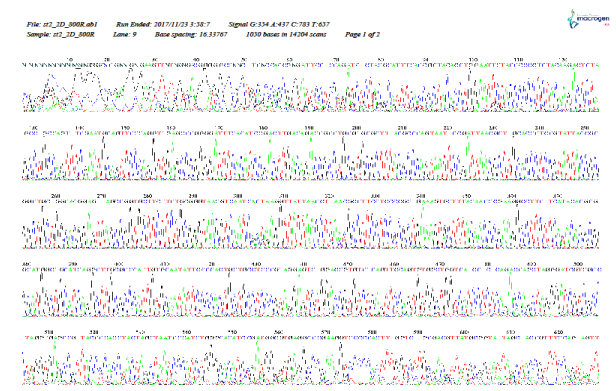
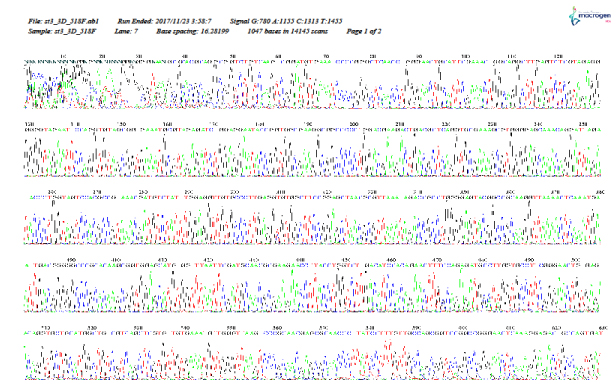
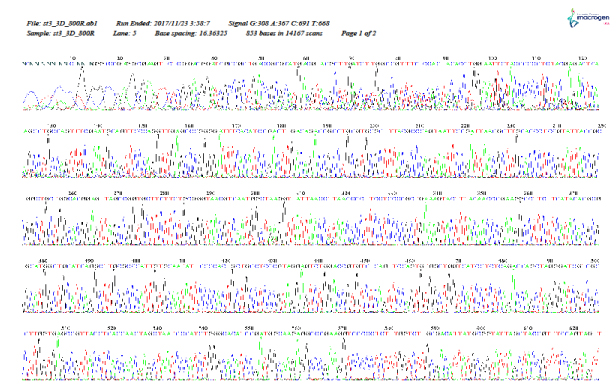
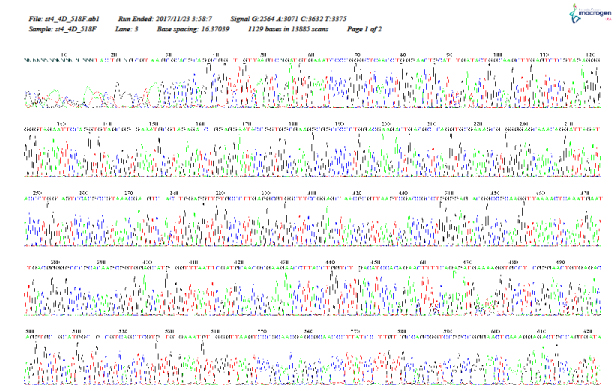
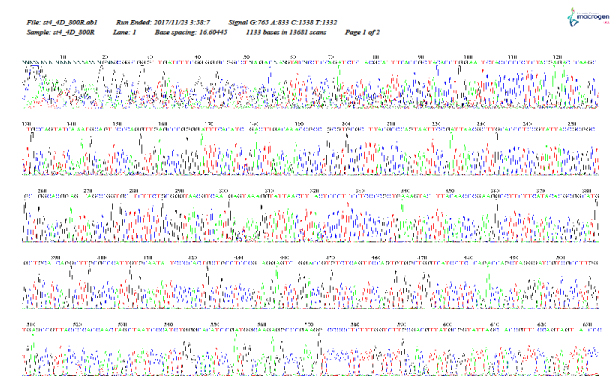
As shown in Figure 5–12, for identification of the strain isolated from patient 1 before chemotherapy, 16S ribosome DNA identification showed that the strain was E. coli strain U 5/41, based on 97% shared sequences, with eight sites matching the reference strain. After chemotherapy, E. coli strain JCM 1649 was identified with 95% homology and six sites matching the reference strain. In patient 2 before chemotherapy, E. coli strain JCM 1649 was identified with 96% homology and six sites matching the reference strain. After chemotherapy, E. coli strain NBRC 102203 was identified with 98% homology and eight sites matching the reference strain.
Figure 5: r16S (F) identification of Escherichia coli isolated from patient 1, 1 week before chemotherapy treatment.
Figure 6: 16S rDNA (R) identification of Escherichia coli isolated from patient 1, 1 week before chemotherapy treatment.
Figure 7: 16S rDNA (F) identification of Escherichia coli isolated from patient 1, 1 week after chemotherapy treatment.
Figure 8: 16S rDNA (R) identification of Escherichia coli isolated from patient 1, 1 week after chemotherapy treatment.
Figure 9: 16S rDNA (F) identification of Escherichia coli isolated from patient 2, 1 week before chemotherapy treatment.
Figure 10: 16S rDNA (R) identification of Escherichia coli isolated from patient 2, 1 week before chemotherapy treatment.
Figure 11: 16S rDNA (F) identification of Escherichia coli isolated from patient 2, 1 week after chemotherapy treatment.
Figure 12: 16S rDNA (R) identification of Escherichia coli isolated from patient 2, 1 week after chemotherapy treatment.
Discussion
The leakage of potassium, phosphorus, sodium, and chloride from E. coli cells before and after chemotherapy treatment was likely caused by damage to cellular regulation due to the effects of chemotherapy on the permeability of the cytoplasmic membrane. Several studies have demonstrated the effects of anions and cations on cellular energy and metabolism [37-43]. Phosphate groups act as major buffer anions; however, cells must use several monovalent cations, including potassium as the major cellular cation. One parameter that controls the movement of potassium is cytoplasmic pH. In E. coli, two mechanisms regulate this effect and vary depending on the pH range in which the mechanisms are active; that is, one mechanism functions in an alkaline environment, and the other functions in an acidic environment [38]. The influx of potassium into E. coli is essential for the recovery of its turgor and is required for growth after an osmotic challenge, whereas glutamate levels increase only slightly after osmotic shock. The transporters that mediate potassium uptake seem to be controlled by turgor, although the systems involved in potassium acquisition in osmotically stressed cells have not yet been identified at the molecular level [37].
The effects of chemotherapy on E. coli cells, as reflected in acid and gas production, may be due to the bacteria resisting the effects of cell wall damage and the permeability of the cytoplasmic membrane. Nevertheless, the isolated strains of E. coli have the ability to ferment lactose and produce acids and gas. Variations in gas and acid production have been demonstrated in several studies, supporting our current findings that E. coli have the potential to produce acids and gas under certain conditions [44-45]. The damage to the cell wall could be observed in the electron micrographs and was likely due to the active compounds in the chemotherapy, which may have caused osmotic stress in the cells or disrupted cell membrane regulation. Similar results have been reported with regard to the effects of antibiotics on the cell wall, permeability of the cytoplasmic membrane, and functions of enzymes, proteins, and toxins [29,46-50].
The observed variations in isolated E. coli before and after chemotherapy may be caused by several factors. For example, reformation of microbiota after chemotherapy could allow adaptation to new strains of E. coli with greater ability to grow in harsh environments. Alternatively, the predominant E. coli can change after chemotherapy, as demonstrated in our experiments. Notably, strain U 5/41 (DSM30083, JCM1649, and NBRC102203) has been identified as serovar O1:K1:H7. Differences between isolated strains of E. coli U 5/41, JCM1649, and NBRC102203 before and after chemotherapy treatment were identified at the phylogeny, genotype, and phenotype levels. Phylogeny and pathology may be highly related, and pathology can be induced by alterations in only one or two genes, such as tynA and csgD genes Nevertheless, new strains that are uncommonly rich in prophages, macrocolony and biofilm formation, and swimming motility have been identified and characterized in the female urinary microbiota [51-55].
Conclusion
In this study, we investigated the effects of chemotherapy on E. coli as species of Enterobacteriaceae in patients with cancer. Our results suggested that chemotherapy treatment may result in the generation of bacteria with new metabolic functions. Thus, we recommend that chemotherapy should be administered in conjunction with a probiotic nutrition system under appropriate medical supervision.
Acknowledgment
We would like to thank Erfan & Bagedo General Hospital for assistance with this study.
There are no references
