Journal Name: International Journal of Cancer and Treatment
Article Type: Research
Received date: 26 July, 2018
Accepted date: 31 October, 2018
Published date: 05 November, 2018
Citation: Kodali M, Vidyasagar MS, Vadhiraja BM, Fernandes DJ (2018) Protein Profile Studies of Cervical Tissue Homogenates Using HPLC-LIF. Int J Cancer Tremnt. Vol: 1, Issu: 1 (47-52).
Copyright: © 2018 Kodali M. This is an open-access article distributed under the terms of the Creative Commons Attribution License, which permits unrestricted use, distribution, and reproduction in any medium, provided the original author and source are credited.
Abstract
Cervical cancer is the most common malignancy among women. Paptest and Colposcopy the existing screening methods were shown to be prone to false positive / negative results. Detection of tumor markers at very low concentrations could not only enhances the sensitivity and specificity of cancer detection but also amplifies the viability of detection of tumor beforehand. Thus, we have employed High Performance Liquid Chromatography coupled with Laser Induced Fluorescence (HPLCLIF) that can typify proteins at femto/subfemto mole levels. Tissue homogenates were prepared from seven malignant and four controls by 6 strokes with each revolution time of 30 seconds in saline. Principle Components Analysis (PCA) was employed as multivariate statistical tool. PCA is a data reduction technique where large amount of spectral data is described in terms of small number of independent variables called ‘eigenvectors’ and the scaling constants used to reconstruct the spectra are known as ‘scores’. Scores of factors are widely used parameter for classification of tissue types. Our finding indicates PCA of first derivative chromatograms in 1250-2700 seconds region with 5 factors distinguished normal and malignant chromatograms.
Keywords
Cervix cancer, Tissue homogenate, Principal components analysis, HPLC-LIF.
Introduction
Cervical cancer is a potentially preventable disease; however, it remains the most common gynecologic malignancy worldwide [1]. Though Paptest and Colposcopy are the existing screening methods they are often prone to false positive/negative results [2,3]. This might be attributed to subjective interpretation of the histopathology and requires skilled personnel. An advance in molecular biology and high throughput technologies has provided the hope of discovering novel biological markers in screening and early diagnosis of cervical carcinoma [4]. Several proteomics based studies reported that Serum Squamous Cell Carcinoma antigen (SCC), CA125 [5,6] Gasdermin-like (GASDML) which belongs to Gasdermin-domain-containing protein family [7] could be used as biomarkers in screening of cervical cancers. Studies also reported that HPV E6 & E7 oncoproteins might help in development of cervical cancer specific markers [5]. However, immuno assays are generally applicable only for detection of single marker at a time and time consuming. Detection of several individual markers, in single run could enhance the chances of early detection.
Optical spectroscopic methods Raman [8,9] Fourier Transform Infrared (FTIR) [10,11] and laser induced fluorescence [LIF] [12-15] have been shown to be promising alternatives in cancer diagnosis. In our earlier studies we have demonstrated Raman spectroscopic diagnostic methodology of cervical cancers [9]. However, these methods could provide gross information of the spectral markers such as proteins, lipids and DNA. As a next approach an attempt has been made to substantiate the feasibility of identification of individual biomarkers, which are known to be superfluous in diseased state. To achieve this, we have developed a unique setup in our laboratory which is capable of detecting sub femtomole levels of proteins. This setup comprises of High-Performance Liquid Chromatography coupled to Laser Induced Fluorescence (HPLC-LIF). In our earlier studies have demonstrated the diagnostic potential of this technique in oral [16,17], and cervical cancers [18-20] using less invasive serum samples and tissue homogenates in breast cancers [21,22]. However, in malignancy cervical tissues not only manifest profound increase in quantity of several proteins but also formation of numerous additional proteins compared to normal. Therefore, we have explored the practicality of recognition of chromatographic markers in carcinoma of uterine cervix.
Materials and methods
Sample collection, processing and storage
Tissue biopsies were obtained from eight study participants of cervical carcinoma FIGO stage IIIB (age group 35-67) from Department of Radiotherapy and Oncology, Shirdi Sai Baba Cancer Hospital, Kasturba Hospital, Manipal. Four tissue samples harvested from regular hysterectomy which are devoid of cervical malignancy were used as controls. These samples were collected in saline; then snap frozen using liquid nitrogen and stored at -80 oC if required. These samples were passively thawed to room temperature 30 minutes before the experiment.
Preparation and standardization of tissue homogenate
In our experiment, dried tissue is minced with normal saline (10% w/v) and homogenized on an ice bath by using manual homogenizer (T8 blade IKA-WERKE). In our trail runs we have identified that protein concentration of 10% homogenate prepared in saline, 6 strokes with each revolution time of 30 seconds is ideal to extract maximum protein concentration from the tissue. Contents were centrifuged at 5000 rpm for 10 min and supernatant was collected. The supernatant was once again centrifuged for 5 min to remove the traces of residual debris, which were then examined under microscope. Debris free 20μl of the clear supernatant was injected to HPLC column and chromatograms were recorded using inhouse HPLC-LIF setup.
Standardization of tissue homogenate is the vital phase in the sample preprocessing. Predominantly this step is to ensure the consistency of protein concentration of diverse tissue homogenates which facilitates correlation of various chromatograms from discrete categories. In pursuit of homogenization the specimens were quantified for the total protein content using spectrophotometric method (Biuret method) at 450 nm.
HPLC-LIF setup
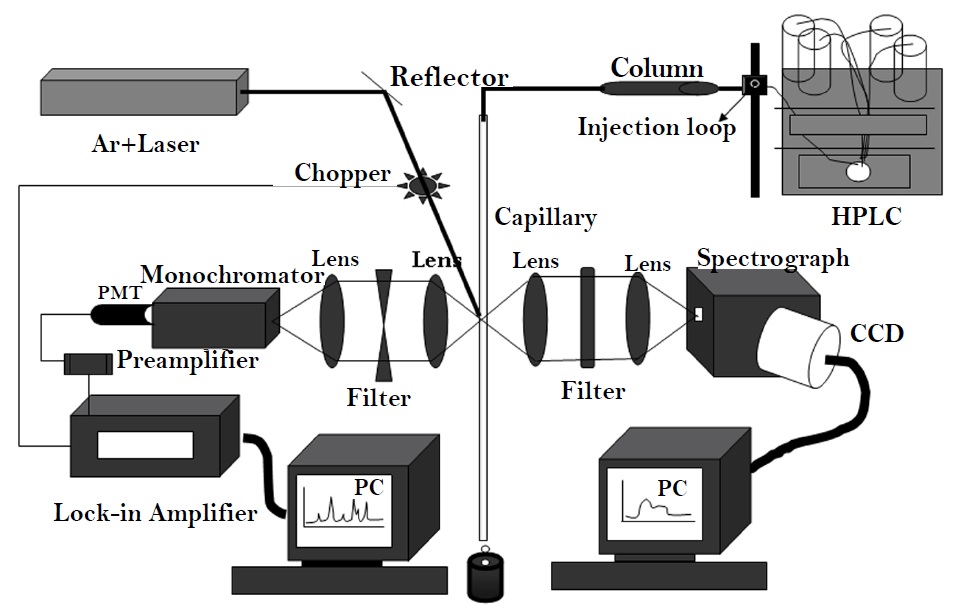
We have employed Reverse phase HPLC system in the present study. This comprises of biphenyl narrow bore column connected through PEEK tubing to the system, is used for separation of proteins. The separated proteins are eluted out through the quartz capillary of 75μm diameter. The chromatographic conditions were solvent gradient of 30-60 % in 60 min and the flow rate is 0.2ml/min. An intra-cavity frequency doubled Ar+ laser (257nm, 10 mW) obtained by doubling 514.5 nm with a BBO (Beta-Barium Borate) crystal was used for fluorescence excitation at 340 nm. Laser beam is tightly focused onto the capillary. The proteins present in the effluent are excited due to interaction with laser beam and get fluoresced. The emitted fluorescence is collimated and collected by the collection optics and then focused onto the monochromator which is set at 340 nm. The signal detected by monochromator is converted to the electrical signal by photo multiplier tube and is further amplified by the preamplifier. The signal is chopped at entrance slit at 20Hz for Lock-in detection. The chromatogram is recorded via lock-in chromatographic peak-detection arrangement which is interfaced to PC (Figure 1). Details and specifications of instrumentation were discussed elsewhere [16-18]. The fluorescence signal obtained from proteins is emitted as peak on the time axis (x-axis) and concentration of the protein is quantitated as intensity on y-axis.
Figure 1: Schematic layout of HPLC-LIF setup.
Data analysis
Chromatograms were subjected to preprocessing before analysis. Chromatograms were background corrected by fitting a third order polynomial and derivatization to remove the inference of background fluorescence. In order to minimize/avoid run-to-run variations of peak positions chromatograms were calibrated by shifting to injection peak along time scale (X-axis). Injection peak is considered as internal standard as it appears in all chromatograms. After interpolation to region of interest, chromatograms are thus subjected to Principle Components Analysis (PCA) using algorithms implemented in Grams 32, PLS plus/IQ, Galactic Industries Corporation, USA. In brief, PCA is a Factor model in which the factors are based on summarizing the total variance. With PCA, unities are used in the diagonal of the correlation matrix computationally implying that all the variance is common or shared. Algorithm lacking underlying model.
Common factor analysis: Factor model explores a reduced correlation matrix. That is, communalities (r2) are inserted on the diagonal of the correlation matrix, and the extracted factors are based only on the common variance, with specific and error variances excluded. Explores underlying “latent” structure of data. Model assumes variability partition able into common and unique components:
Eigenvalues: Also called characteristic roots. The eigenvalue for a given factor measures the variance in all the variables which is accounted for by that factor. The ratio of eigenvalues is the ratio of explanatory importance of the factors with respect to the variables. If a factor has a low eigenvalue, then it is contributing little to the explanation of variances in the variables and may be ignored as redundant with more important factors. Eigenvalues measure the amount of variation in the total sample accounted for by each factor. A factor’s eigenvalue may be computed as the sum of its squared factor loadings for all the variables. Note that the eigenvalues associated with the unrotated and rotated solution will differ, though their total will be the same.
Factor loadings: The factor loadings, also called component loadings in PCA, are the correlation coefficients between the variables (rows) and factors (columns).
In the current study, PCA was carried out under different conditions: entire range and selected regions and derivatives of the same regions using different number of factors. The number of significant factors can be decided by several techniques such as Eigenvalues, total % variance and spectral loadings. In our trail run first derivative spectra in 1250 – 2700 seconds region with 6 factors yielded best results. Scores of factor was employed as discriminating parameter [16].
Results
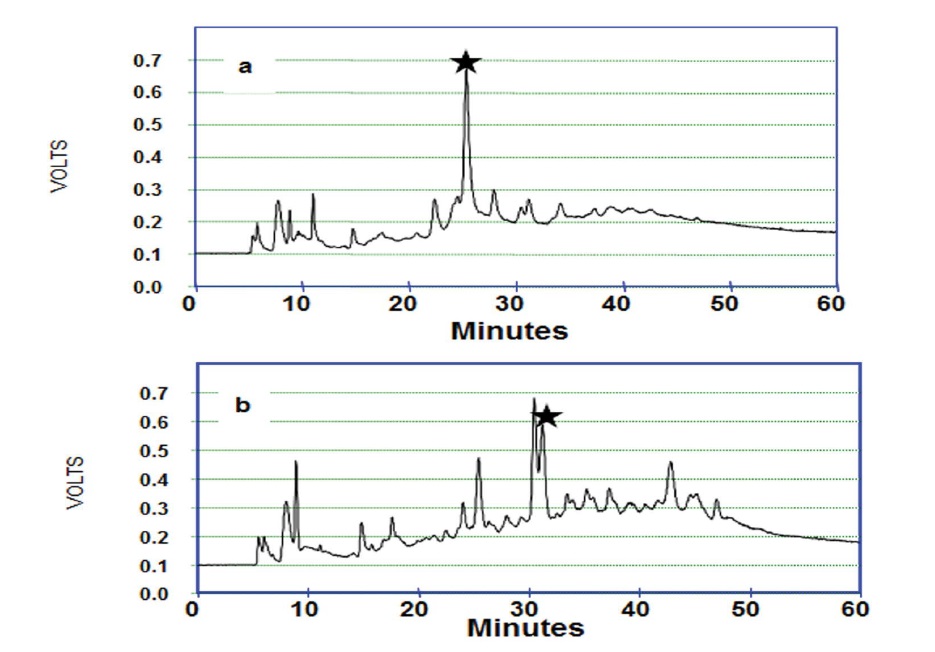
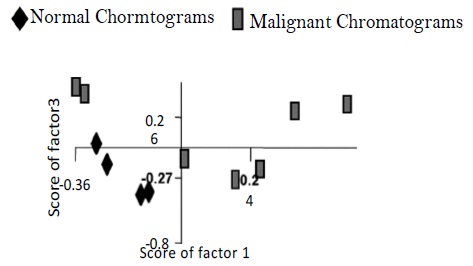
Figure 1 depicts the HPLC-LIF setup employed for recording chromatograms from the normal and malignant cervical tissues. Typical chromatograms of normal and malignant cervix tissue homogenates were shown in Figure 2. It is evident from the figure that major differences were illustrated in the 1250 – 2700 seconds region. Broad shoulder in peak 4 was exemplified in malignant chromatograms. It is appreciated that peak 8a which emerged in malignant was not seen in normal chromatogram. Furthermore, the magnitude of the double peak (Peak 9) is significantly high in the malignant compared to normal chromatogram. It is very prominent that peaks 10, 12, 16, 17, 18 were absent / negligible in normal compared to malignant chromatograms (Figure 2). Identification of individual peaks that are excessive in the malignant is not performed in the current study. These chromatograms were converted into spectra and analyzed by Principal Component Analysis (PCA). Figure 3 demonstrates unsupervised analysis of normal and malignant chromatograms. Mean and standard deviation values of score of factor 1 for normal and malignant conditions were 0.083+0.018 and -0.041+0.369. Mean and standard deviation values of score of factor 2 for normal and malignant were 0.0751+0.021 and -0.037+0.37.
Figure 2: Typical chromatograms of a) normal and B) malignant cervix tissue homogenate.
Figure 3: Unsupervised analyses of normal and malignant chromatograms of cervix tissue homogenate.
Discussion
In recent years, there has been an increased interest in developing techniques that allow the rapid and accurate diagnosis using optical spectroscopy. Even though spectroscopy in its various forms has been shown to be an important component of non-invasive diagnosis of various cancers, the coupling of a LIF with HPLC system appears to be challenging. It brings to the forefront the prospect of diagnosing cancer at an early stage but also detecting at very low concentrations which could eventually help us in intensifying treatment schedules for patients thus sparing them additional morbidity and cost.
In view of this we have employed reversed phase HPLC coupled with LIF to detect the femto mole concentration of the proteins and verify the feasibility of discrimination between normal and malignant tissue homogenates. This not only improves the sensitivity and specificity of cancer detection but also enhances the feasibility of detecting tumor at very low concentrations of proteins. The main advantages of this method over Raman and LIF are HPLC-protein profile changes with the progression of disease and identification of protein decomposition that occurs during progression of the disease at sub femto mole levels (or still lower quantities) of proteins as they flow past a probing laser beam. The sensitivity can be enhanced by several orders of magnitude by controlling HPLC. Raman spectra of any given class (say proteins) will be similar; hence it is difficult to identify the changes that take place in protein decomposition.
However, very few studies have been reported in the literature in diagnosis of oral [16,17] and cervical cancers [18-20] using this system using serum samples. Studies are also reported in the diagnosis of breast cancers using tissue homogenates by this technique [21,22]. To best of our knowledge no attempts has been made to verify the diagnostic ability of the technique using tissue homogenates in cervical cancers. Hence in the present study we have attempted to verify diagnostic ability of cervical cancers using tissue homogenates.
The chromatograms of the specimens in our pilot study showed certain important differences (Figure 2). Broad shoulder in peak 4 is observed in malignant compared to normal. The increased magnitude of the double peak (Peak 9) in the malignant might suggest the redundancy of that protein quantitatively to a certain extent. The absence / negligible of the peaks 8a, 10, 12, 16, 17, 18 in normal may serve as the biomarkers during the progression of carcinogenesis. However, no attempt has been made to identify proteins which are represented as peaks of the chromatogram. Thus, the peak numbering ascertained in the present study is merely to compare the typical chromatographic patterns of normal and malignant conditions [23,24].
It is well known that optical methods are amenable to several multivariate statistical tools such as Hierarchical Cluster Analysis (HCA), Artificial Neural Networks (ANN), k-means nearest neighbor (KNN) maximum representation and discrimination feature (MRDF), Principle Components Analysis (PCA) available for data mining. However, as mentioned earlier we have opted PCA as discriminating tool in our second approach. As mentioned earlier, PCA is a well-known dimensionality reduction technique where large spectral data are reduced into small number of independent variations known as factors or principal components and contributions of these factors are called scores. Scores of factor was employed as discriminating parameter [25]. As stated in ‘Data Analysis’ section analysis was carried out in full region, selected regions and derivatives of the same. As mentioned earlier derivatization was more advantageous because background was automatically corrected. Background in the chromatographic runs could arise from laser light scattered from capillary walls, fluorescence of the organic modifier (acetonitrile) in the gradient, PMT dark count etc. Due to back ground fluorescence slight inclined slope in the chromatograms was observed. In this case baseline correction by third order polynomial might induce artifacts. Hence, we have opted for derivatization (widely used in FTIR spectroscopy) of chromatograms to minimize baseline / back ground induced artifacts.
As mentioned in the ‘Data Analysis’ section in our analysis PCA of 1st derivative spectra in the region of 1250- 2700 seconds region, with 5 factors yielded best results and further analysis was carried out under these conditions. PCA is a data reduction technique where large amount of spectral data is described in terms of small number of independent variables called ‘eigenvectors’ or ‘factors’ or ‘principal components’ and the scaling constants used to reconstruct the spectra are known as ‘scores’. Scores of factors are widely used parameter for classification of tissue types. Our findings suggest that PCA of derivative chromatograms gave better discrimination. Unsupervised analysis of normal and malignant chromatograms produced two different clusters corresponding to normal and malignant tissue types (Figure 3). These results are in agreement with the earlier studies using serum samples [18,19]. Mean values of score of factor 1 and 2 of malignant showed an upward trend compared to normal. The appearance of a greater number of peaks in malignant conditions might implicate the redundancy of proteins during progression of carcinogenesis. The magnitude of peak 9 in malignant condition suggests the increased quantity of the proteins when compared to normal. This study needs to be continued by recruiting larger sample size as well as other pathological conditions subsequently acquiring calibration sets for each condition.
Conclusions
Unlike normal chromatograms emergence additional peaks suggests the augmentation of diverse proteins in the malignancy. Using this technique normal and malignant condition was clearly discriminated. Additional peaks in malignancy could be suggested as redundancy of proteins during progression of cervical carcinogenesis. Identification of these proteins could lead to new tumor biomarkers in cervical malignancy. The efficacy of this technique should be verified with large trails. Prospectively models will be developed for normal and different pathological conditions.
Acknowledgements
The work was carried out under the project entitled ‘Laser spectroscopy as predictor of tumor response to radiotherapy in cervical cancer’, funded Department of Atomic Energy; Board of Research in Nuclear Sciences (DAE-BRNS), Govt. of India No. 2003/34/17/BRNS/1903. Authors acknowledge technical support of Mr. Chetan Anand. Dr. C. Santosh, Head of the Department, Center for Atomic and Molecular Physics (CAMP) was also acknowledged. One of the authors (MK) is grateful to DAE-BRNS for Research Fellowship.
There is no references


