Journal Name: International Journal of Nano Research
Article Type: Research
Received date: 12 December 2018
Accepted date: 21 December 2018
Published date: 28 December 2018
Citation: Khanegahi BA, Sedghi H. (2018) Effect of Annealing Temperature on Optical Properties of ZnS Thin Films Studied by Spectroscopic Ellipsometry Analysis Method. Int J Nano Rech Vol: 1, Issu: 2 (12-17).
Copyright: © 2018 Khanegahi BA. This is an open-access article distributed under the terms of the Creative Commons Attribution License, which permits unrestricted use, distribution, and reproduction in any medium, provided the original author and source are credited.
Abstract
In this work the effect of annealing temperature on optical properties of zinc sulfide (ZnS) thin films grown on glass substrates by sol-gel spin-coating method is investigated. Different annealing temperature (300, 400 and 500ºС) were used for investigation. Zinc acetate (Zn (CH3COO)2.2H2O) and thiourea (CH4N2S) were used as precursors. 2-methoxyethanol and monoethanolamin were used as solvent and stabilizer respectively. Spectroscopic ellipsometry method was used to calculate the optical properties of ZnS thin films such as refractive index, extinction coefficient, dielectric function and optical band gap energy. An optical model consisting of a glass substrate/ZnS thin film/ surface roughness layer/air structure was used to calculate the optical parameters. The measured spectroscopic ellipsometry parameters Ψexp and Δexp are fitted against the designed model by minimizing the mean square error (MSE). Considering the data obtained, it can be deduced that the optical properties of ZnS films is highly influenced by annealing temperature. The refractive index of the films were increased with increasing annealing temperature of the films. From these the optical band gap of the ZnS films were measured between 3.00 eV and 3.33 eV.
Keywords
Spectroscopic ellipsometry; Annealing temperature; Thin film; Zinc sulfide; Optical properties.
Introduction
ZnS has attracted considerable research interest due to its variety of applications, such as optoelectronic devices [1], photoluminescence [2], photoconductors [3], optical sensors [4], phosphors [5], solar cells [6] and etc. ZnS is an important direct gap semiconductor with band gap of ≈3.58eV [7]. ZnS films have been deposited by a number of methods including chemical vapor deposition [8], atomic layer epitaxy [9], RF-sputtering [10], electro chemical deposition [11], chemical bath deposition [12] and sol-gel method [13]. Among these, sol-gel spin coating deposition method is a non-expensive and simple method of producing zinc sulfide films which covers large areas.
Spectroscopic ellipsometry (SE) is an optical measurement technique that characterizes light reflection (or transmission) from samples [14]. Ellipsometry measures the change in polarized light upon light reflection on a sample (or light transmission by a sample). This method measures the two values , (Ψ,Δ) which represent the amplitude ratio and phase difference between light waves known as p- and s-polarized light waves respectively. In spectroscopic ellipsometry, (Ψ,Δ) spectra are measured by changing the wavelength of light.
In this work the optical properties of ZnS thin films with different annealing temperatures were examined using spectroscopic ellipsometry measurement. The optical characteristics of the films produced by this method are described.
Materials and Methods
ZnS samples were prepared via sol–gel method using the spin-coating technique. The sol was prepared with Zn(CH3COO)2.2H2O and CH4N2S as starting precursors and 2-methoxyethanol and monoethanolamine as solvent and stabilizer respectively. The molar ratio of MEA to zinc acetate was maintained at 1.0. The S/Zn molar ratio was 1 in the mixture. To obtain a homogeneous solution, it was stirred at 80 ºС for 120 min. The solution was aged for 24 h at room temperature to increase its viscosity. Prior to deposition, the glass substrates were cleaned with acetone and methanol and distilled water. ZnS thin films were deposited on glass substrates using spin coater at the coating speed of 3600 rpm. After deposition, the films were preheated in air for 10 min at 200ºС to evaporate the solvent and remove organic residuals. Thermal annealing was performed at 300, 400 and 500 ºС in air for one hour. SE method was used to extract the optical parameters of the layers such as optical band gap. Ellipsometry parameters, (Ψ, Δ) were recorded at an incidence angle of 70 º.
Results and Discussion
Ellipsometry is an indirect optical technique in that information about the physical properties of a sample is obtained through modeling analysis. The optical properties of ZnS thin films grown on glass substrates were investigated by using spectroscopic ellipsometric measurements. The experimental data was taken at an incident angle of 70º and then fitted theoretically using Lorentz model. The (Ψ, Δ) measured from ellipsometry are defined from the ratio of the amplitude reflection coefficients for p- and s-polarizations:
The mean square error is used to qualify the difference between the experimental and fitted data, and is calculated by following equation.
Where σi is standard deviation of the i-th data point, N is number of data point, Mesi is i-th experimental data point and Thi is i-th calculated data point from assumed theoretical model.The best match between the experimental and fitted data obtains when the MSE exhibits a minimum value.
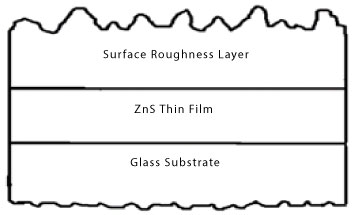
The model used to analyze the ellipsometry data consists of a glass substrate, ZnS thin film, surface roughness layer and air. Surface roughness layer was modelled by effective medium approximation (EMA). Adding surface roughness layer, improves the MSE value compared to the single layer model. The model used to analysis is shown in Figure 1.
Figure 1: The model used for analyzing the ellipsometry data.
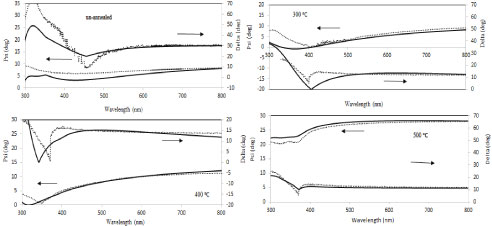
The measured spectroscopic ellipsometry parameters Ψexp and Δexp fitted against the designed model in the spectral range from 300 to 800 nm by minimizing the square error (MSE), is shown in Figure 2.
Figure 2: The experimental and fitted optical parameter (Ψ,Δ) for ZnS thin films with different annealing temperatures.
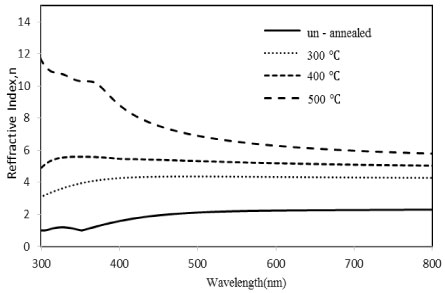
The refractive index of un-annealed and annealed ZnS thin films, calculated by spectroscopic ellipsometry method, is shown in Figure 3. It can be deduced from Figure 3 that by increasing annealing temperature, the refractive index increased. This might be due to increase of surface diffusion in film-air interface and decrease of fraction of voids. In the film prepared without annealing, instead of a homogeneous layer there might be separate grains with voids between them. This leads to low refractive index.
Figure 3: The refractive index as a function of wavelength for ZnS thin films with different annealing temperatures.
The highest refractive index is obtained for 500ºС. By increasing wavelength, the refractive index in all samples was shifted to a constant value, which shows normal dispersion in the visible wavelength region also it can be seen a peak around 360 nm wave-length for the film annealed of 500 °C. The region around this peak is called absorption region. In this region, the absorption of the sample decreased suddenly by increasing wavelength. The refractive index of the sample with 500 °C annealing temperature is more similar to the data obtained for ZnO thin films in car previous work [15,16]. This might be due to possibilities of oxidation by increasing annealing temperature.
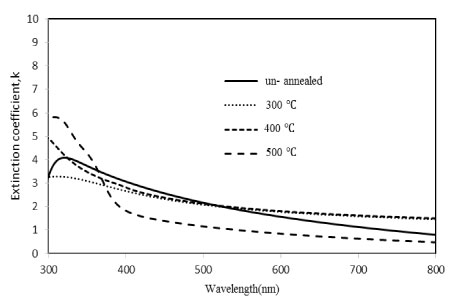
The extinction coefficient as a function of wavelength for ZnS thin films with different annealing temperatures were calculated using spectroscopic ellipsometry method and is shown in Figure 4.
Figure 4: The extinction coefficient as a function of wavelength for ZnS thin films with different annealing temperatures.
It can be deduced from Figure 4 that by increasing wavelength, the extinction coefficient (k) of all layers decreases. The film prepared with 500°C annealing temperature was more transparent in comparision with the other films of this research in the visible wavelength region. In the sample annealed at 500 °C, the absorption edge occurred at lower wavelength region. This region is where we have seen a peak in the refractive index data. Suddenly decrement of the extinction coefficient might be due to lees defects in the sample.
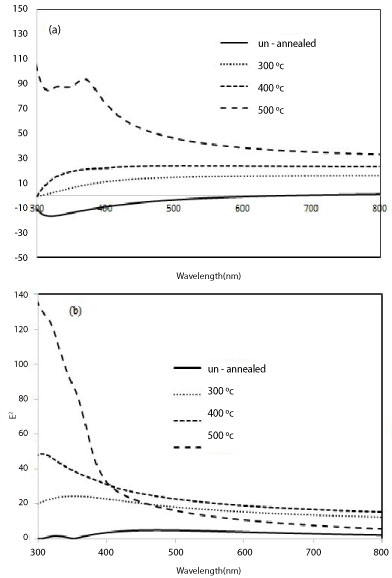
The real and imaginary part of dielectric function obtained by spectroscopic ellipsometry measurement method is shown in Figure.5a and b. Increasing annealing temperatures up to 500 ºС leads to change in real and imaginary part of dielectric function values as a function of wavelength.
Figure 5: The real (a) and imaginary part (b) of dielectric function of ZnS films with different annealing temperatures.
In the real part of dielectric function data, the point that ε1 vanishes is called the plasma frequency point. Below this point, the sample shows metallic behavior and after that dielectric behavior is seen. It can be deduced that the film prepared without annealing, shows metallic behavior below 600 nm wavelength. All the other annealed samples in this work show dielectric behavior in 300-800 nm. Figure 5b shows that by increasing annealing temperatures, the imaginary part of dielectric function increases.
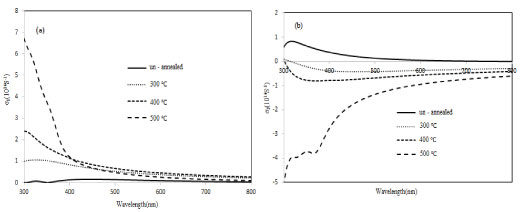
We plotted the real and imaginary part of conductivity as a function of wavelength for different annealing temperatures shown in Figure 6. The optical conductivity is calculated using following equations [17].
Figure 6: Variation of σ_1 (a) and σ_2 (b) as a function of wavelength for ZnS thin films with different annealing temperatures.
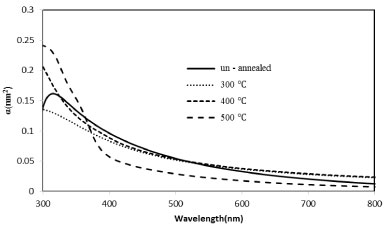
As is shown in Figure 6a increasing annealing temparetures resulted in increasing the real part of conductivity. By increasing annealing temperature, the imaginary part of conductivity in the films decreases to negative values, that is shown in Figure 6b. We have calculated the absorption coefficient as a function of wavelength in ZnS thin films with different annealing temperatures.
The optical absorption coefficient is determined using the following equation [18].
Where (k) is the extinction coefficient and is the wavelength. As is shown in Figure 7, for all films it can be deduced that increasing wavelength leads to decreasing of absorption coefficient to a constant value in visible range.
Figure 7: Variation of absorption coefficient α for ZnS thin films with different annealing temperatures.
The optical band gap (Eg) of thin films was calculated using the absorption coefficient ( ) and is given by Tauc relation [19].
Where A is an energy- independent constant, Eg is the band gap of the material, is photon energy, and n is an index that theoretically equals 1/2 for direct band gap semiconductors such as ZnS.
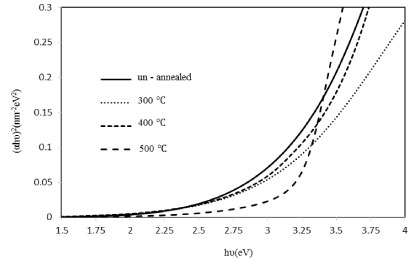
The energy gap Eg value is calculated by extrapolation of the straight line in the plot of the ( )2 versus curve towards energy axis. The variation of ( )2 with photon energy is shown in Figure 8. The optical band gap of the ZnS thin films were measured between 3.00 and 3.33 eV. The film with 400ºС annealing temperature had the highest band gap energy(3.33 eV).
Figure 8: Variation of band gap for ZnS thin films with different annealing temperatures.
The increase of optical band gap could be attributed to the structural and morphological change in the films [20,21]. Other possibilities to explain this change in optical band gap could be related to this point that high temperature annealing leads to transition from cubic to hexagonal phase [22].
The calculated values of optical band gap energy of all films is shown in table1. In this work, Wemple and DiDomenico oscillator model can be used to estimate the energy band structures of thin films. In Wemple and DiDomenico model, each electron is considered as an oscillator. This model suggests that within the spectral range of interest, one of the oscillators is considered to be stronger than the rest of the oscillators [23].
Table 1: The values of optical band gap energy for ZnS thin film with different annealing temperatures.
| Sample | Annealing temperature(ºС) | Energy gap(eV) |
|---|---|---|
| 1 | Un-annealed | 3.00 |
| 2 | 300 | 3.10 |
| 3 | 400 | 3.33 |
| 4 | 500 | 3.25 |
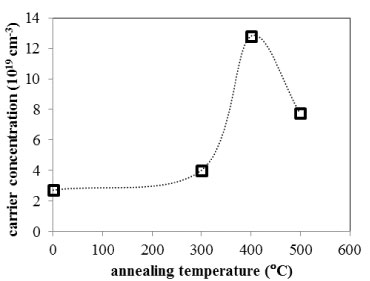
The refractive index that can be analyzed to obtain the free charge carrier concentration N, as follows [24]:
Where, ε∞ is the high frequency dielectric constant, N is the free charge carrier concentration, ε0 is the permittivity of the free space, e is the charge of electron, c is the velocity of light and m* is the effective mass of the charge carriers. From the linear dependence of ε2 vs. λ2, N can be obtained (as shown in Figure 9).
Figure 9: The free charge carrier concentration of ZnS thin films with different annealing temperatures.
Conclusion
In this work, ZnS thin films have been prepared by sol–gel spin coating method and the optical properties of the films with different annealing temperatures were determined using spectroscopic ellipsometry method. The resulted data shows that the band gap energy of the ZnS thin films is found to be dependent on the annealing temperatures. The film with 400ºС annealing temperature had the highest band gap energy (3.33 eV), so was the preferred annealing temperature for ZnS thin film deposition./p>
There are no references
