Journal Name: International Journal of Nano Research
Article Type: Research
Received date: 13 December 2018
Accepted date: 21 December 2018
Published date: 28 December 2018
Citation: Ghosh B, Uppalapati Y, Tadimarri VS, Deshpande K. (2018) Formulation and Evaluation of Sitagliptin Microsponges Using Different Polymers. Int J Nano Rech Vol: 1, Issu: 2 (18-22).
Copyright: © 2018 Ghosh B. This is an open-access article distributed under the terms of the Creative Commons Attribution License, which permits unrestricted use, distribution, and reproduction in any medium, provided the original author and source are credited.
Abstract
Microsponges are designed for deliver a drug at minimum dose, enhanced stability, reduced side effects and controlled drug release profile. In present study Sitagliptin microsponges were prepared by heat stabilization method using natural polymers like chitosan and albumin in different concentrations in different mixing range with drug. Pre formulation study selects good analytical procedures for further work of development. Prepared microsponges were tested for flow properties, percentage yield, and percentage drug content and swelling index. Prepared formulations were checked for cumulative drug release profile of each formulation and optimization done based on these results. Drug release data of optimized formulation was fitted into different release kinetic models, optimized formulation controlled drug release up to 12hrs.
Keywords
Microsponges, Sitagliptin, Chitosan, Albumin, Controlled drug release.
Introduction
All the pharmaceutical products formulated for systemic delivery via the oral route of administration, irrespective of the mode of delivery (immediate, sustained or controlled release) and the design of dosage form, must be developed within the intrinsic characteristics of GI physiology.
The successful development of oral drug delivery systems consists of basic understanding such as:
- Physicochemical, pharmacokinetic and pharmacodynamic characteristics of the drug.
- The anatomic and physiologic characteristics of the gastrointestinal tract.
- Physicochemical characteristics and delivery mode of the dosage form to be designed.
Difficulties conventional oral controlled dosage
- The short gastric retention time (GRT).
- Unpredictable gastric emptying time (GET).
Gastro retentive drug delivery systems
Approaches in gastro retentive drug delivery systems: Several approaches have been worked out to improve the retention of an oral dosage form in the stomach:
- Floating method.
- Expanding method.
- Bioadhesive method.
- Modified shape method.
- High-density method.
- Other delayed gastric-emptying devices.
Advantages of floating drug delivery system
Floating dosage method form vital technological drug delivery systems with gastric retentive behavior and offer several advantages in drug delivery.
These advantages include:
- Controlled delivery of drugs.
- Delivery of drugs for local action in the stomach.
- Simple and conventional equipment for manufacture.
- Easy to inhale and better patient compliance.
- Site-specific drug delivery.
Disadvantages of floating drug delivery systems
- Gastric retention is influenced by many factors such as gastric pH, presence of food and motility. These factors are never stable and hence the buoyancy cannot be predicted.
- Drugs that cause irritation and abrasion to gastric mucosa inappropriate to be formulated as floating drug delivery systems.
- High variability in gastric emptying time due to its all or non-emptying process.
types of floating drug delivery system
Based on the method of buoyancy, two different technologies have been utilized in development of FDDS which are:
- Effervescent System
- Non- Effervescent System.
Mechanism of floating microspheres
When microspheres come in bond with gastric fluid, the gel formers, polysaccharides, and polymers hydrate to form a colloidal barrier that controls the rate of fluid diffusion into the device and consequent drug release. As the exterior surface of the dosage form dissolves, the gel layer is maintained by the hydration of the adjacent hydrocolloid layer. The air trapped by the swollen polymer lowers the density and confers buoyancy to the microspheres. However a minimal gastric content is needed to allow proper achievement of buoyancy.
Mechanism of drug release from microspheres: This includes three types
- Diffusion
- Erosion
- Osmosis
Methodology
Pre formulation studies
Results of the below mentioned characters of the drug was described in table 1
Table 1: Description of Sitagliptin (API).
| Test | Description | |
|---|---|---|
| Colour | White to off white crystalline powder | |
| Solubility | Water | soluble |
| pH6.8 Phosphate buffer | Soluble | |
| Methanol | Slightly Soluble | |
| Chloroform | Slightly Soluble | |
| Melting point | 2150c | |
- Description
- Solubility
- Melting point
Preparation of calibration curve for sitagliptin Standard curve of sitagliptin in 0.1N HCl
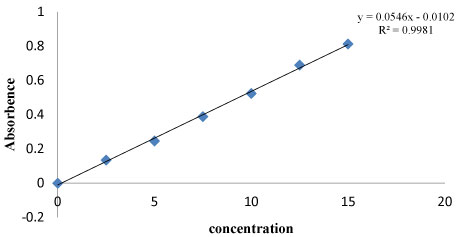
Standard and secondary stock solutions were prepared, from these various concentrations were prepared and note the absorbance using UV at 288nm. Slope and linearity of the drug was calculated by plotting a graph of absorbance with concentration. Percentage of the drug absorbance was given in table 2 and calibration curve of Sitagliptin was shown in figure 1.
Table 2: Calibration curve data of sitagliptin.
| Concentration (µg /ml) | Absorbance |
|---|---|
| 0 | 0 |
| 2.5 | 0.135 |
| 5 | 0.246 |
| 7.5 | 0.389 |
| 10 | 0.524 |
| 12.5 | 0.689 |
| 15 | 0.816 |
Figure 1: Calibration curve plot of Sitagliptin.
Method of preparation
Heat stabilization technique: Drug is diffuse in mixture of 5ml of 1%w/v albumin solution, 5ml of 2%w/v chitosan in 2% acetic acid and pour into 5ml of 15% w/v gelatin solution (water) containing 1.5% w/v CaCO3 and syringe in to 25ml of liquid paraffin containing 0.5% w/v span 80 gently stirred for 10min at 60-700c and 1000rpm ( w/o emulsion is formed) then it is cooled at 50 0c for 30min , washed with petroleum ether and dried at 450 c.
Post formulation parameters
- Percentage yield
- Flow properties: Bulk density, Tapped density, Angle of repose
- Drug entrapment efficiency
- Swelling study
- In vitro drug release
- In vitro drug release
Results and Discussion
Pre formulation studies
Preformulation studies like description, solubility and melting point for the drug were done and the results were explained in table 1.
Standard curve of sitagliptin in 0.1N HCl
Slope and linearity of the drug was calculated by plotting a graph of absorbance with concentration. Percentage of the drug absorbance was given in table 2 and calibration curve of Sitagliptin was shown in figure 1.
Evaluation of flow properties of microspheres
Preparation of the floating beads using different formulations is given in table 3. Evaluation of parameters like Bulk density Tapped density Carr’s IndexAngle of repose(θ) of Sitagliptin Microspheres with different formulation from Si1-Si9 was calculated and shown in table 4.
Table 3: Floating beads formulation with different polymer ratios.
| S.No. | Formulation code | Drug: Polymer ratio | Polymer ratio (Albumin: Chitosan |
|---|---|---|---|
| 1 | Si1 | 1:1 | 1:1 |
| 2 | Si2 | 1:1.5 | 1:2 |
| 3 | Si3 | 1:2 | 1:3 |
| 4 | Si4 | 1:1.5 | 2:1 |
| 5 | Si5 | 1:2 | 1:1 |
| 6 | Si6 | 1:2.5 | 2:3 |
| 7 | Si7 | 1:2 | 3:1 |
| 8 | Si8 | 1:2.5 | 3:2 |
| 9 | Si9 | 1:3 | 1:1 |
Table 4: Data for sitagliptin microspheres for micro particle analysis (Si1-Si9).
| Formulation code |
Bulk density (g/cc) |
Tapped density (g/cc) |
Carr’s Index | Hausner Ratio |
Angle of repose(θ) |
|---|---|---|---|---|---|
| Si1 | 0.45 ± 0.045 | 0.52 ± 0.09 | 15.60 ± 0.2 | 1.15 ± 0.02 | 28.06 ± 0.31 |
| Si2 | 0.45 ± 0.045 | 0.50 ± 0.07 | 12.23 ± 0.6 | 1.11 ± 0.04 | 27.58 ± 0.15 |
| Si3 | 0.44 ± 0.044 | 0.50 ± 0.09 | 12.58 ± 0.8 | 1.13 ± 0.08 | 28.44 ± 0.11 |
| Si4 | 0.45 ± 0.045 | 0.52 ± 0.04 | 15.19 ± 0.1 | 1.15 ± 0.06 | 28.36 ± 0.13 |
| Si5 | 0.44 ± 0.044 | 0.52 ± 0.01 | 15.48 ± 0.6 | 1.18 ± 0.08 | 28.52 ± 0.19 |
| Si6 | 0.45 ± 0.044 | 0.51 ± 0.04 | 13.48 ± 0.8 | 1.13 ± 0.09 | 29.32 ± 0.19 |
| Si7 | 0.51 ± 0.046 | 0.59 ± 0.04 | 14.48 ± 0.8 | 1.15 ± 0.09 | 29.69 ± 0.19 |
| Si8 | 0.44 ± 0.045 | 0.52 ± 0.04 | 15.19 ± 0.1 | 1.15 ± 0.05 | 27.36 ± 0.23 |
| Si9 | 0.44 ± 0.04 | 0.50 ± 0.1 | 12.58 ± 0.8 | 1.13 ± 0.09 | 29.32 ± 0.16 |
All formulation shows angle of repose in an excellent range from 27-29. These formed micro sponges were easily fit into final dosage form as capsule or tablet or any coated formulations.
Percentage yield and percentage drug entrapment efficiency
The percentage yield and percentage drug entrapment efficiency of the sitagliptin microspheres prepared with different formulation of polymers Si1-Si9 was shown in table 5.
Table 5: Percentage yield and percentage drug entrapment efficiency of the prepared Microspheres.
| S.No. | Formulation code | % yield | Drug Content (mg) | % Drug entrapment efficiency |
|---|---|---|---|---|
| 1 | Si1 | 80 | 79.40 | 62.66 |
| 2 | Si2 | 83.33 | 78.66 | 64.4 |
| 3 | Si3 | 85 | 78.70 | 66.66 |
| 4 | Si4 | 86 | 79.5 | 70 |
| 5 | Si5 | 82.22 | 71.07 | 73.2 |
| 6 | Si6 | 80 | 72.25 | 75 |
| 7 | Si7 | 88 | 85.29 | 88.66 |
| 8 | Si8 | 87 | 83.5 | 86.66 |
| 9 | Si9 | 80 | 83.01 | 83.73 |
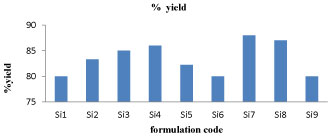
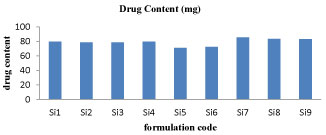
Percentage yield and drug content: It was observed that as the polymer ratio in the formulation increases, the product yield also increases. The low percentage yield in some formulations may be due to blocking of needle, adhesion of polymer solution to the magnetic bead and beads lost during the washing process. The percentage yield was found to be in the range of 80 to 88% for microspheres containing albumin and chitosan. The graphical representation of percentage yield and drug content of different formulation of sitagliptin microspheres were shown in figure 2 and 3.
Figure 2: % yield for Si1-Si9 formulations.
Figure 3: Drug content graph for Si1-Si9 formulations.
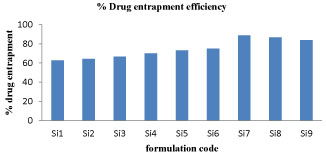
Drug entrapment efficiency: The drug entrapment efficiency of the prepared beads increased progressively with an increase in proportion of the respective polymers. Increase in the polymer concentration increases the viscosity of the dispersed phase. The particle size increases exponentially with viscosity. The higher viscosity of the polymer solution at the highest polymer concentration would be expected to decrease the diffusion of the drug into the external phase which would result in higher entrapment efficiency. The graphical representation of drug entrapment efficiency of different formulation of sitagliptin microspheres were shown in figure 4.
Figure 4: % Drug entrapment efficiency graph for Si1-Si9 formulations.
Swelling index
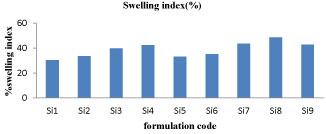
Swelling index is also proportional to the polymer concentration and SI varies from 30-48%. In these formulations Si4, Si7, Si8 and Si9 shows good swelling index and SI predicts prominent data regarding controlled release. The graphical representation of swelling index of different formulation of sitagliptin microspheres were shown in figure 5.
Figure 5: % swelling index for Si1-Si-9 formulations.
In vitro drug release
Paremeters:
- USP type – I rotating basket
- Dissolution Medium: 0.1N HCL
- Volume: 900ml
- Bowl temperature: 37 ± 0.5°C
- RPM: 100rpm
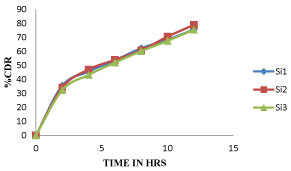
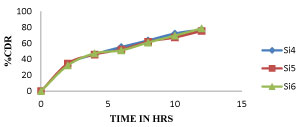
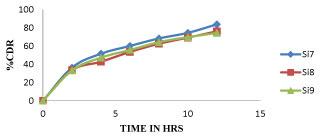
Among all the formulations Si7 shows more sustained after 9 hour whereas all other shows optimum sustained action like Si7 but Si7 shows highest drug release at 12Hr, whereas remaining all other shows less percent of drug release so Si7 was optimized as best formulation. The cumulative percentage of drug release of different formulation of sitagliptin microspheres were given in tables 6-8 and the graphical representation of in-vitro drug release were shown in figures 6-8.
Table 6: Dissolution data for sitagliptin microspheres.
| Time (hrs) | Cumulative Percent Drug Release (n = 3 ± SD) | ||
|---|---|---|---|
| Si1 | Si2 | Si3 | |
| 0 | 0 | 0 | 0 |
| 2 | 35.42 ± 3.2 | 34.16 ± 1.25 | 32.26 ± 1.2 |
| 4 | 45.55 ± 1.21 | 47.01 ± 1.34 | 43.15 ± 7.34 |
| 6 | 53.61 ± 1.65 | 53.89 ± 1.9 | 51.95 ± 8.7 |
| 8 | 62.16 ± 3.47 | 60.72 ± 1.30 | 60.12 ± 2.8 |
| 10 | 68.31 ± 2.02 | 70.49 ± 0.93 | 67.48 ± 1.34 |
| 12 | 75.6 ± 1.25 | 78.89 ± 1.56 | 75.43 ± 1.65 |
Table 7: Dissolution data for sitagliptin microspheres.
| Time (hrs) | Cumulative Percent Drug Release (n = 3 ± SD) | ||
|---|---|---|---|
| Si4 | Si5 | Si6 | |
| 0 | 0 | 0 | 0 |
| 2 | 33.24 ± 1.8 | 34.59 ± 2.2 | 32.15 ± 0.9 |
| 4 | 46.12 ± 5.52 | 45.87 ± 0.67 | 47.24 ± 5.8 |
| 6 | 55.23 ± 5.3 | 52.03 ± 7.17 | 51.02 ± 3.06 |
| 8 | 63.5 ± 1.22 | 61.82 ± 7.65 | 60.85 ± 1.92 |
| 10 | 72.145 ± 1.48 | 67.22 ± 4.19 | 69.52 ± 1.35 |
| 12 | 77.29 ± 1.88 | 75.29 ± 4.84 | 78.56 ± 4.3 |
Table 8: Dissolution data of sitagliptin microspheres.
| Time (hrs) | Cumulative Percent Drug Release (n = 3 ± SD) | ||
|---|---|---|---|
| Si7 | Si8 | Si9 | |
| 0 | 0 | 0 | 0 |
| 2 | 36.32 ± 0.18 | 33.52 ± 2.52 | 33.25 ± 0.61 |
| 4 | 51.62 ± 0.63 | 42.83 ± 4.51 | 47.31 ± 0.62 |
| 6 | 60.18 ± 1.25 | 53.61 ± 7.02 | 55.72 ± 2.22 |
| 8 | 68.42 ± 0.15 | 62.58 ± 7.59 | 64.32 ± 3.83 |
| 10 | 74.59 ± 13 | 69.32 ± 7.81 | 69.85 ± 0.67 |
| 12 | 83.91 ± 3.16 | 76.25 ± 1.89 | 74.45 ± 3.21 |
Figure 6: Dissolution profile of Sitagliptin Microspheres (Si1, Si2, Si3) formulations.
Figure 7: Dissolution profile of Sitagliptin Microspheres (Si4, Si5, Si6) formulations.
Figure 8: Dissolution profile of Sitagliptin Microspheres (Si7, Si8, Si9) formulations.
In vitro drug release kinetics
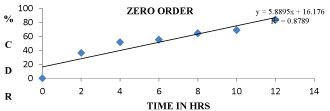
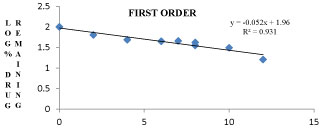
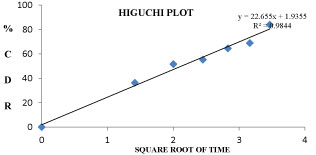
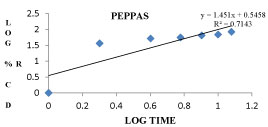
The Si7 formulation follows first order kinetics with R2 value of 0.9317 and also follows Higuchi model with an R2 value of 0.9844 and also follows non fickanian model of drug release. The graphical representation of release kinetics were shown in figures 9-12.
Figure 9: Zero order graph for Si7 Formulation.
Figure 10: First order graph for Si7 formulation.
Figure 11: Higuchis model graph for Si7 formulation.
Figure 12: Peppa’s model graph for Si7 formulation.
Conclusion
The present study has been a satisfactory attempt to formulate microsponges of Sitagliptin, a new anti-diabetic drug giving a controlled release of the drug. From the experimental results it can be concluded that,
- FT-IR study shows no significant shifting of the peaks therefore it confirms the short term stability of the drug in the beads.
- The overall curve fitting into various mathematical models was found to be on an average. The formulations Si7 best fitted into First order kinetic model and Higuchi model [1-10].
There are no references
