Journal Name: International Journal of Nano Research
Article Type: Research
Received date: 22 January, 2024
Accepted date: 26 February, 2024
Published date: 04 March, 2024
Citation: Feuerstein GZ, Xiaoying Z, Marcinkiewicz C, Dikin DA, Tu X, et al. (2024) Pilot Studies towards Development of Fluorescent Nanodiamonds Particles FDPNV-700/800nm as Carriers of Doxorubicin for Imaging and Adjuvant Treatment of Hepatocellular Cancer. Int J Nano Rech Vol: 7, Issu: 1 (01-26).
Copyright: © 2024 Feuerstein GZ. This is an open-access article distributed under the terms of the Creative Commons Attribution License, which permits unrestricted use, distribution, and reproduction in any medium, provided the original author and source are credited.
Abstract
Purpose: To test doxorubicin-coated fluorescent diamonds particlesNV-700/800nm (FDP-DOX) for potential treatment for hepatocellular cancer (HCC).
Methods:
Human liver cancer cell-line (Hep-3B-luc) was used to induce orthotopic liver cancer in BALB/c mice. Hepatocellular cancer cells rapidly induced tumors in the left liver lobe where their progression was evaluated in vivo by extracorporeal whole-body bioluminescence method. Ex vivo imaging of FDP-DOX distribution in the liver and tumor-tissues was enabled by near infra-red (NIR) light emitted by FDP-NV and UV-vis for presence of DOX. FDP-DOX distribution at the cellular level was analyzed by scanning electron-microscopy (SEM) and immunohistochemistry. Liver function tests (LFT) and complete blood cells counts (CBC) were used for off target safety biomarkers.
Results:
FDP-DOX administered via intravenous (IV) route to naïve or tumor bearing BALB/c mice, were dose-dependently and preferentially (95%) deposited in liver-sinusoids, reaching maximal retention dose (MRD). FDP-DOX were prominently identified in liver sinusoids and DOX detected in liver-cells nuclei by UV-vis fluorescence. FDP-DOX injected IV to mice seven days ahead of Hep-3B-luc inoculation suppressed tumor development over 4 weeks. Commencing FDP-DOX treatment 7 days after tumor cell inoculations failed to arrest tumor development.
Conclusions:
The data presented in this manuscript suggest that FDP-NV-700/800nm could serve as carrier for DOX as part of the contemporary TAE/TACE (transarterial embolization/transarterial chemotreatment) strategy for HCC adjuvant treatment.
Keywords:
Orthotopic Hepatocellular cancer, BALb/c mice, near infra-red light, Scanning electron microscopy, trans-arterial chemoembolization.
Introduction
Primary hepatocellular cancer (HCC) is a leading malignancy worldwide and common cause of death due to very poor long-term survival [1-4]. Over the past 3 decades HCC prevalence has increased in the USA and other countries with male gender bias [1,2]. HCC prevalence has been attributed to several co-existing medical conditions such as chronic viral hepatitis, metabolic diseases (diabetes, obesity), behavioral trends (alcohol abuse, diets), as well as comorbidities such as liver cirrhosis and environmental factors (chemical carcinogens) [5-8].
Autologous liver transplantation is the preferred treatment for non-alcoholic cancer in whom liver functions tests are sufficiently preserved [1]. Liver transplantation and local ablation are considered potentially curative in carefully selected patients, yielding 5-year survival rates of 40–70%, compared with 20% in untreated patients [9]. However, access to suitable liver transplants continues to lag demand. Targeted tumors’ resections, or ablations, have also been proven to prolong “progression free survival” yet most patients are diagnosed late in the course of the disease, and consequently and invariably are subjected to high rate of recurrence [10-13].
Over the past 20 years microcatheter technology has been evolving to afford trans-arterial embolectomy (TAE) via the hepatic artery of patients diagnosed with multifocal liver tumors yet ineligible for transplantation or resection/ablation procedures [14,15]. TAE combined with chemotherapeutic agents (TACE) has rapidly evolved with a myriad of chemotherapeutics agents and diverse carriers [16-22]. Prominent among the chemotherapeutic agents deployed by TACE procedures are anthracycline compounds, which have proven partial efficacy mostly by “progression free survival” (PFS) in both pre-clinical and clinical studies, but not in overall survival (OS).; only 2 drugs have been registered for human use [23-31]
Combination of TAE/TACE technology have mostly demonstrated efficacy in prolonging “progression free survival” (PFS), but less so in respect to overall survival (OS) [24-27]. In fact, recent meta-analysis of studies comparing a first line HCC drug, sorafenib, Vs combined with TACE (doxorubicin) cast doubt on TACE added value [20-31]. Concerns have also been raised regarding embolization materials spreading beyondthe hepatic-artery perfusion territory leading to non-targeted embolization with significant adverse consequences [32]. Hence, carriers that localizes in the tumor and slowly desorbs its chemotherapeutics agents could enhance efficacy and specificity.
Multiples factors seem to confound TAE/TACE clinical studies outcome. Likely, the main culprits reside residing in the diverse physical compositions of the drug carriers such as polymers, dendrimers, starch, gels, liposomes, Lipiodol, and drug eluting spheres (DES) [22-24]. Furthermore, diverse pharmacological adjuvants, e.g., anthracyclines, (doxorubicin, paclitaxel, pirarubicin) that vary in their pharmacokinetics profiles might have confounded clinical outcomes [27,33-35]. Finally, DES (drug eluting spheres) deposited within the hepatic artery varied by size (40- 300 um), and diffusion of the chemotherapeutics into the systemic circulation some of which degraded by rapid metabolism in the liver and other peripheral organs [23,35].
Taken together, the state of the art of TAE/TACE platforms provides a compelling case for superior carriers that could address the substantial unmet medical needs including overall survival (OS).
Recently, we have reported on preferential deposition of sub-micrometer fluorescent diamond particles, FDPNV-700/800 nanometer (nm) (FDP-NV) in liver’s sinusoids of rodents following intravenous injections of FDP-NV, in accord with reports of similar data with much smaller nanodiamonds particles (<100nm) [36-40]. Furthermore, we reported on the exceptional biocompatibility of FDPNV-700/800 nm in rodents with respect to safety over prolonged residency (90 days) in the liver with high preferential and sustained residency due to lack of FDP-NV metabolism and excretion [36-38]. Furthermore, our in vitro studies with human liver cancer cells (HepG-2 and Hep3B) and colorectal cancer organoids, [38-40], have shown rapid and avid internalization of FDP-NV or FDP-DOX in each of the HCC cancer cells (vide supra), forming corona around the cells’ nucleus yet non in the nuclei per se [41]. These in vitro experiments also affirmed desorption of DOX from the particles and its diffusion to the nuclei resulting in time and dose-dependent destruction of cancer clusters within 24-48 hours via activation of cell-death pathways, impaired mitochondria functions and activation of oxygen radicals’ formation [41,42]. This data, along with exceptional FDP-NV biocompatibility, sustained residencyin targeted pathology/ organ, and, slow release of the chemotherapeutic agents (e.g., DOX) suggested that FDP-DOX might be an appropriate candidate to be tested as for TACE adjuvant for HCC [42-50].
In this pilot study, we aimed to establish proof of concept (POC) for the potential of FDP-NV-700/800 nm coated with doxorubicin to serve as an effective drug carrier. To this end, FDP-DOX was loaded in the left lobe of the liver ahead of an intended inoculation of Hep-3B-luc cancer cells that induce tumor in the same locale where DOX is expected to be desorpted from the particle. Towards this objective several ancillary POC tasks had to be clarified and verified.
Material and Methods
Nanodiamonds Particles acquisition and characterization
FDP-NV-700/800 nm (FDP-NV) functionalized by surface carboxylation was purchased from ADAMAS Nanotechnologies Inc. (Raleigh, NC, USA). The doxorubicin used for the FDP-NV coating was purchased from MedKoo Biosciences, (Morrisville, NC, USA). The coating process and desorption profile (conducted by the supplier) have been detailed in a recent publication except for the higher payload per mg FDP-NV mass which was achieved by increasing DOX concentration in basic PBS solution. The FDP-DOX-75 product was delivered in autoclaved sterile Eppendorf plastic vials [41].
FDP-NV and FDP-DOX were characterized for diameter (Z-average) and surface charge (ζ-potential) using dynamic light scattering (DLS). Particles delivered by the manufacturer as a suspension in sterilized deionized water. Z-average and ζ-potential of FDP-NV-700/800 nm were tested before and after coating with doxorubicin. FDP-DOX products were provided in various DOX coatings up to FDPDOX-75 µg/mg particles.
Human liver cancer cells acquisition application
Hep-3B-luc human liver cancer cells were obtained by the contract research organization WuXiAppTec (Shanghai, China). Cells were kept in medium supplemented with 10% fetal bovine serum at 37°C with 5% CO2 in air. Hep3B-luc tumor cells were sub-cultured twice weekly, during the exponential growth phase, and harvested for tumor inoculation at 3x10⁶ cells per mouse. Cells were inoculated into the left lobe of the livers under adequate anesthesia.
In vivo BALB/c mice studies f`emale nude mice (20–22 g, 6–8 weeks old) were purchased from Beijing Vital River Laboratory Animal Co Ltd for use at WuXiAppTec facilities (Shanghai, China). All in vivo protocols were exercised at WuXi (China) and performed under accredited procedures as per Chinese Regulatory Agency according to IACUC, which are in line with US FDA and NIH guidelines.
Dispersion of particles by sonication prior to infusion into animals
Due to the innate tendency of FDP-NV-700/800 nm (FDP-NV) for agglomeration in electrolyte solutions (normal saline, PBS pH=7.4) all suspensions of particles were subjected to vortex (over 2 minutes) followed by sonication.
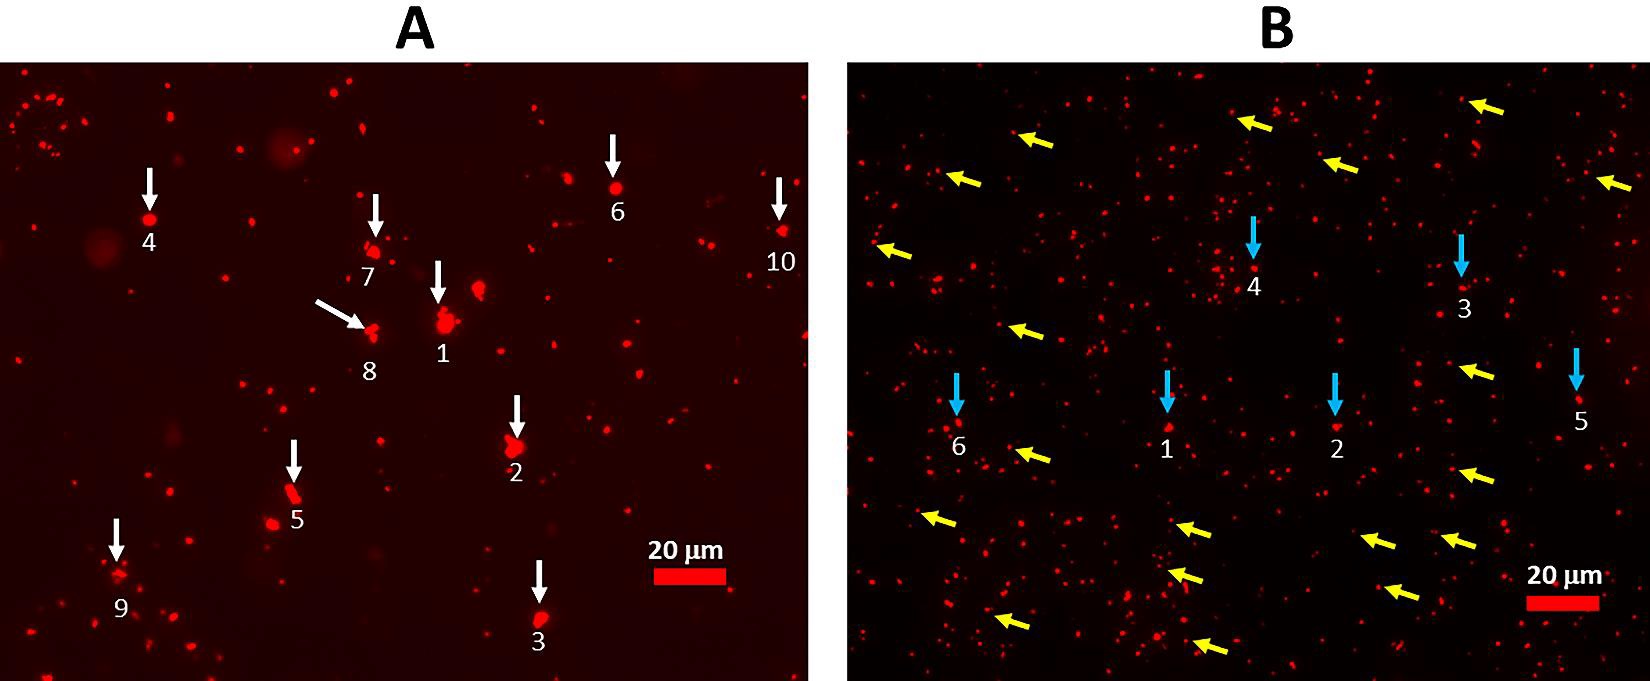
To facilitate particle dispersion, BSA at 3% was added to PBS pH=7.4 and the suspension was also subjected to high vortex stirring for 3–5 min followed by sonication in a water bath for 10–15 minutes using a Digital ultrasonic cleaner machine (Kq -50TDB, Kunshan Ultrasonic Instrument Co Ltd, Jiangsu, China) at 150 W and a frequency of 80 kHz while maintaining water temperature in the range of 20–25°C; an example of particles dispersion after sonication is provided in figure 1.
Cell culture
Hep-3B-luc (human liver cancer cell-line) was established by injecting of 3x10⁶ Hep-3B-luc cells suspended in twenty µL Matrigel (1:1/w: w) into the left lobe of the liver of female BALB/c nude mice under proper anesthesia (see Methods).
Whole-body bioluminescence of Hep-3B-luc tumors in nude mice
BALB/c mice inoculated with Hep-3B-luc cells were administered by IV luciferin through through their tail vein vein at a dose of 150 mg/kg. Five to ten minutes after injection of luciferin, the mice were lightly anesthetized by inhalation of 2% isoflurane in air. Upon proper anesthetic state, mice were transferred into the imaging chamber for bioluminescence measurements using the Lumina III (PerkinElmer, Inc., Waltham, USA) imaging system. The bioluminescence value at 15 min after injection of luciferin was recorded as the maximum final value.
Ex vivo tumor bioluminescence and NIR fluorescence monitor by using In Vivo Imaging System (IVIS)
The distribution of FDP-NV-700/800nm or FDP-DOX in livers, isolated tumors, and ancillary organs was measured by IVIS Lumina III (PerkinElmer, Inc., USA) using the Ex/Em setting at 580 nm/710 nm, respectively with auto-exposure setting time and ‘binning’ set at 4. All ex vivo images of organs were performed on organs that were dissected at termination day of the protocol. Whole-body perfusion of mice was performed under deep anesthesia by cardiac puncture using sterile normal saline.
Figure 1: Dispersion of FDP-DOX-34 suspended in PBS=7.4 by sonication. (A) Image of FDP-DOX-34 after vertexing (no sonication) observed under fluorescence microscopy. The maximum diameters of the six largest agglomerates are as follows: 1) 6.4 µm, 2) 5.8 µm, 3) 4.6 µm, 4) 5.4 µm, 5) 5.1 µm, 6) 3.7 µm, 7) 4.4 µm; 8) 5.2 µm, 9) 2.9 µm, 10) 3.4 µm. (B) Image of FDP-DOX-34 after sonication, observed under fluorescence microscope. The max diameters of the six largest particles indicated by blue arrows are as follows: 1) 1.9 µm, 2) 1.7 µm, 3) 1.8 µm, 4) 1.2 µm, 5) 1.2 µm, 6) 1.6 m. yellow arrows point examples of the particles in the size 700/800 nm. Measurement of particle diameters was performed using Image J software.
Scanning electron microscopy
Scanning electron microscopy (SEM) was used to confirm the location and formation of particles in the liver and tumor tissues isolated from FDP-DOX-infused mice. The procedure was performed as described previously [22]. Briefly, 800 µg/mouse dose of FDP-DOX was injected intravenously under appropriate anesthesia. Mice were terminated (see euthanasia section vide infra) and subjected to whole-body perfusion through cardia puncture followed by dissection of the liver tumor units and ancillary organs. Certain dissected specimens were subject to fixation in 70% ethanol and further cut into 2-3 mm slices. Slices were imaged using an environmental SEM (Quanta 450FEG, FEI Co, ThermoFisher Scientific) operated in low vacuum mode at 0.3–0.4 Torr of water evaporation and 7–10 keV of acceleration voltage.
Euthanasia of animal subjects
Euthanasia was induced in accordance with WuXi humane animal guidelines by using standard phenotype changes to avoid animal suffering. Mice were placed in a chamber ventilated with at least 95% CO2 and maintained at 2.7 L/min to 6.3 L/min, throughout the euthanasia process. At the point of complete cessation of all motor activity, breathing, and complete unconsciousness, a cardiac puncture was performed and a perfusion with 10 mL of sterile saline was performed to remove residual blood in the vasculature of the organs. Organs were preserved in 4.5% buffered formaldehyde PBS (pH = 7.4).
Blood withdrawal for circulating blood, biomarkers
Blood was withdrawn by cardiac puncture under proper anesthesia (5% isoflurane) into anticoagulantcontaining syringes (EDTA). LFT (liver function tests) and hematological variables were processed using standard clinical biochemistry methods.
Histology, Histochemistry and fluorescence techniques
Preparation of slices: Paraffin preserved blocks were deparaffinized and sectioned at 4 µm by a manual rotary microtome (Histoscore Multicut, Leica GmbH, Wentzler, Germany).
H&E and DAPI staining: Slides were exposed to sixty °C for 1 hour for dewaxing and were then transferred to TissueTek Prisma® Plus auto stain (Sakura Fintech lunch, Torrance, CA, USA) for H&E staining. The stained slides were scanned with panoramic digital slide scanners (panoramic SCAN, 3DHISTECH Kit, Budapest, Hungary). A liver pathologist expert evaluated high-resolution images. For nuclei imaging, slides were processed by the Bond RX auto Stainer (Leica GmbH, Wetzlar, Germany) for DAPI staining.
Fluorescence imaging: Slides were scanned with panoramic digital slide scanners (panoramic Scan, 3DHISTECH Kft, Budapest, Hungary) with filters. Highresolution imaging for whole sections was generated and analyzed. For additional technical details, see references [21,23].
Immuno-Histochemical methods (IHC) to identify liver and tumor Phagocytic cells: CD68 biomarker
CD68 (macrosialin) is a heavily glycosylated transmembrane protein that is expressed by and commonly used as a marker for monocytes and macrophages. CD68 was used as a proxy biomarker to locate macrophages in liver and tumor slices according to published information (https://pubmed.ncbi.nlm.nih.gov) [50-52]. Slides were exposed to 60ºC for an hour to dewax and then transferred to Bond RX auto Stainer (Leica GmbH, Wetzlar, Deutschland) for IHC staining. The primary antibody used for immunehistochemistry (IHC) was anti-CD68 (CST #97778).
Imaging technology
All images were scanned at 40x magnification (panoramic SCAN, 3DHISTECH Kit, Budapest, Hungary). Hematoxylin and Eosin (H&E) images were generated at bright field and fluorescence images were generated with DAPI (Ex/Em=377/447) for nuclei imaging, SpGr-B (Ex / Em=494/527), while DOX and SpRed (Ex/Em=586/628) for FDP-NV. All images were obtained with CaseViewer V2.4 (3DHISTECH Kft, Budapest, Hungary). For image analysis the HALOTM platform (Indica Labs, Albuquerque, NM, USA).
Tumor area evaluation: The tumor area distinguished by H&E staining was easily differentiated from liver cells zones (using the Annotations model in HALO). The tumor area was calculated using software, which included, in addition to tumor cells, hollow zones, necrosis, and stroma.
Tumor cell counts: Cells were identified by nuclei using the Cytonuclear model in HALO and the model was run on the tumor cell area obtained above; tumor cell counts were calculated by the software. Data were imported into GraphPad Prism (GraphPad Software, San Diego, CA, USA) from which the bar graph was generated including error lines that represent standard error of the mean (Sem) based on n=5 for each of the three variables in at P <0.001 by t-test.
Alfa-Fetoprotein immunohistochemistry
Alfa-Fetoprotein (AFT) is an oncofetal liver antigen that is normally produced transiently by the fetal liver, but ceases expression in adults when the immune system is fully developed. AFP is commonly used as a biomarker to monitor treatment outcome in patients with HCC [43,44]. Because Hep-3B-luc are known to express AFT, we used this protein as a biomarker to differentiate Hep-3B-luc tumor cells from mice hepatocytes with respect to the distribution of FDPDOX.
Liver slices 4-µm-thick were sectioned by Leica RM2235 Manual Rotary Microtome (Leica Microsystems GmbH, Germany), then deparaffinized/rehydrated by sequential washing (Xylene, ~100–75% Ethanol and PBS). After antigen retrieval by the microwave heating in EDTA buffer (MVS-0098, MXB Biotechnologies, Foochow, China) and peroxidase quenching in 3% hydrogen peroxide for 5 min, the slides were blocked by blocking buffer (SP KIT-B2, MXB Biotechnologies, Foochow, China) and stained using primary Anti-alpha 1 fetoprotein antibody (Anti-AFP, #284388, Abcam) at 1:50 dilution in antibody dilution buffer (#AR9352, Leica) overnight at 4°C using the Opal 7-Color Automation IHC Kit 50 (NEL821001KT, PerkinElmer, USA). Subsequently, the DAPI stained slides were mounted with Prolong Diamond Antifade mounting (P36961, Invitrogen) and scanned with Aperio Versa 8 (Leica Microsystems GmbH, Germany).
Inoculation of Hep-3B-luc (human cancer cells) into the left lobe of liver of BALB/c mice
Female BALB/c nude mice were anesthetized with 240 mg/kg of Avertin 2–5 minutes beforesurgery. A small incision was made across the sterilized abdominal wall. The left lobe of the liver was identified and exposed. Approximately 3×10⁶ Hep3B-Luc cells were inoculated with 20 µL Matrigel (Becton Dickinson, Franklin Lakes, USA). Twenty microliters (µL) of PBS: Matrigel (at 1:1) were injected directly into the left lobe of the liver. The injection site was inspected to ensure there was a lack of leakage. The left lobe of the liver was then adjusted back into the abdominal cavity, and the incision was closed by surgical sutures. Mice were monitored after surgery for complete recovery from anesthesia.
Data presentation, analysis, and statistics
Data are presented as mean ±1 SD or standard error of the mean (Sem) as indicated in the figure legends. Statistical analyses were performed by ANOVA, and where appropriate, using SigmaPlot software (SigmaPlot® 12 SPSS, Sy stat Software Inc., San Jose, CA, USA). Statistical significance was established at P< 0.05. Plots were prepared using SigmaPlot software. For the nonlinear regression dynamic fitting plot, the standard four-parameter logistic curve was drafted using SigmaPlot software. A mixed model ANOVA on log transformed luminescence was performed for the analysis of tumor bioluminescence assessed by whole body luminescence. Treatment and time were analyzed as fixed effects, and an interaction was also included. Animals were considered a random effect nested within treatment and analyzed using the REML method to account for the repeated measures. Three samples registered a luminescence far below other samples and were excluded from the analysis. The residuals appeared normal and uncorrelated, with Shapiro–Wilk and Anderson–Darling p>0.3. ANOVA and all fixed effects were significant with P <0.0001. Test slices of the interaction were used to assess the time dependence of the treatment and control groups. For specific time point comparisons, Tukey HSD post hoc was used with α = 0.01.
Results
Characterization of FDP-NV and FDP-DOX-75 by DLS
FDP-DOX-75 was manufactured by ADAMAS where the Z-average and zeta-potential of FDP-NV and FDP-DOX were evaluated by Malvern at the manufacturer as previously reported. Z-average and zeta-potential were studied at N=3 each as follows: FDP-DOX-75 Z-average is 755 +/- 3.5 (SD, and standard error of the mean (Sem) of 2.07 +/- 0.22 mV.
The zeta potential of FDP-DOX-75 was minus 21.2 +/- 0.11 mV SD (or 0.11 Sem). Since FDP-DOX-75 was suspended in 3 % BSA (bovine serum albumin), a negatively charged protein, the coated particles retained a negative (minus) 21mV post-coating as compared to a positive surface charge in a PBS suspension.
Suitability of FDP-DOX for targeted delivery of doxorubicin to tumor-bearing livers
FDP-NV-700/800 nm have not been studied in BALB/c orthotopic liver cancer as far as the authors could deduced from public literature. Therefore, we embarked on de novo studies of FDP-DOX. Validation of extent of deposition of FDP-DOX in mouse livers and exploring the Maximal Retention Dose (MRT). Furthermore, we evaluated whether particles gain access to liver and tumor cells. We considered this latter parameter, MRD, paramount to ensure maximal deposition of the therapeutic agent in the targeted organ/ pathology and minimize systemic adverse effects due to systemic overflow of FDP-DOX. Finally, we characterized the dynamics of Hep-3B-luc tumor development within the liver with respect to the time and extent of tumor evolution in situ and further in outgrowth into the abdominal space and secondary metastases to other organs. This information was used to guide FDP-DOX dosing regimens and schedules in various stages of tumor burden (early, 2–3 weeks; medium, 4–7 weeks, and late-stage, 9-weeks). Furthermore, detailed MRD is critical not only for optimizing dose regimens to target pathology but also for preventing liver dysfunction indicated by liver function tests (LFT) and other systemic toxicities (such as hematological variables).
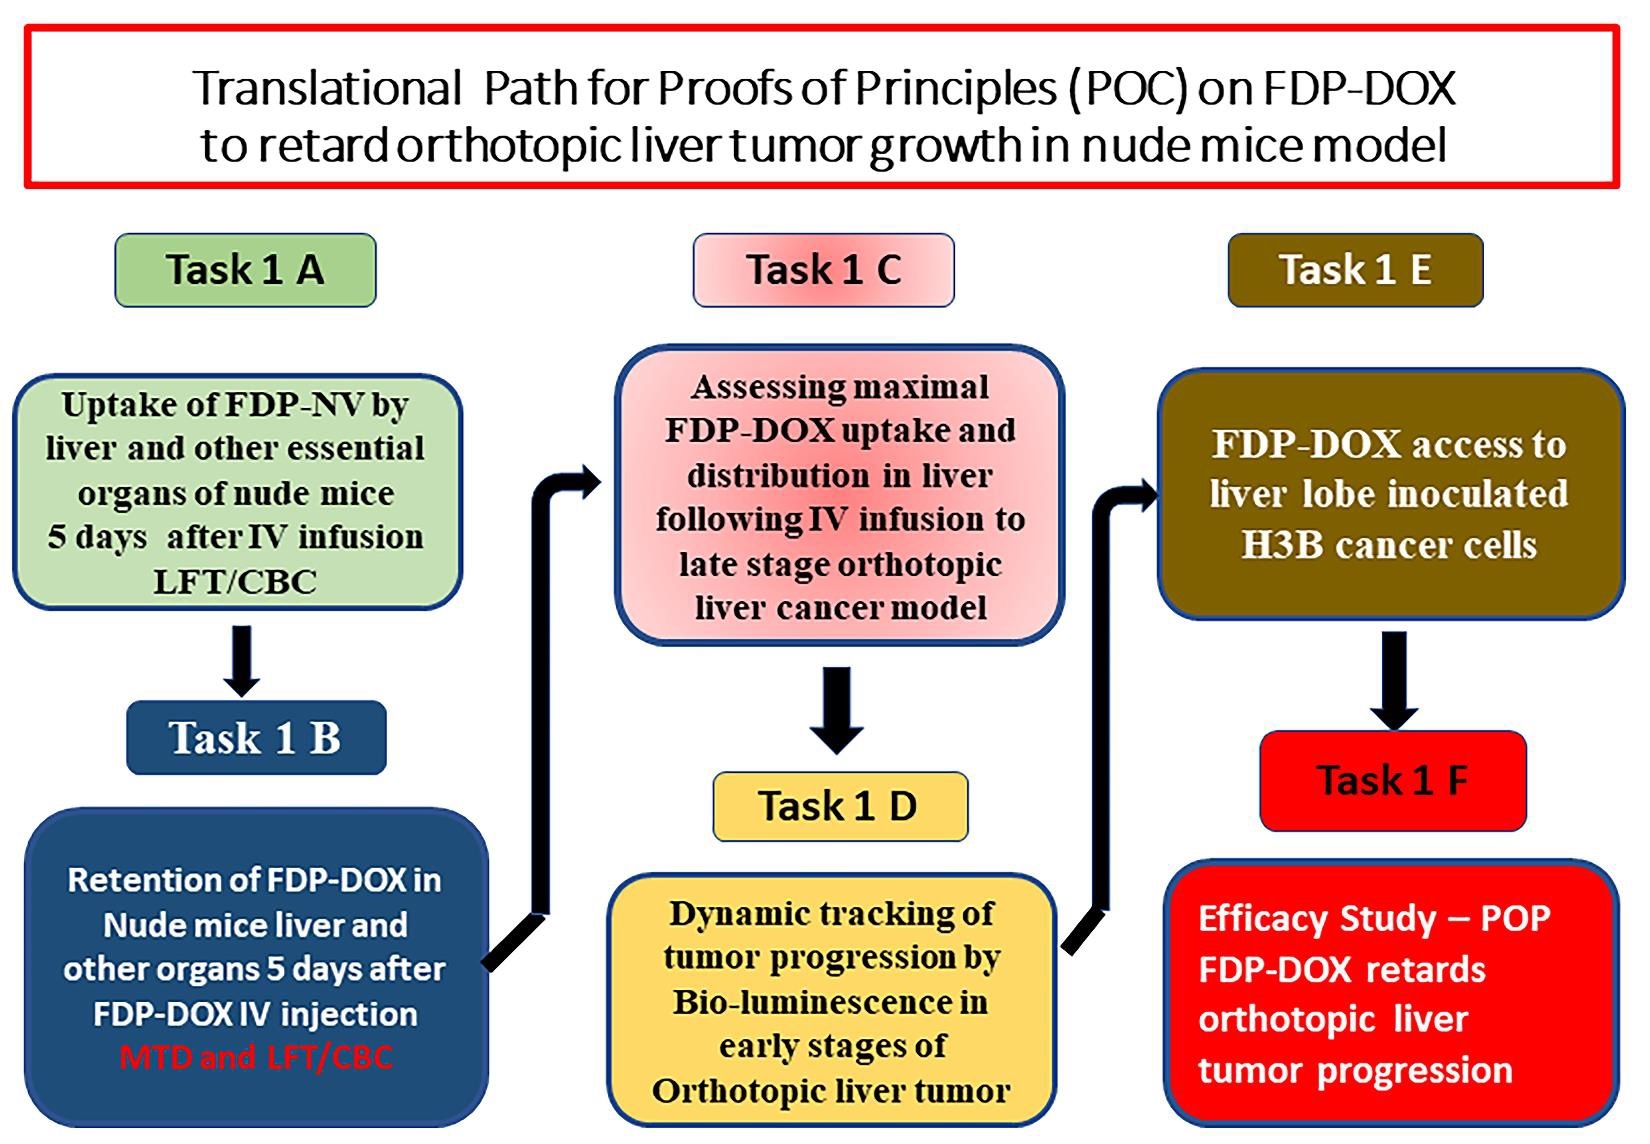
Figure 2 presents five pilot studies (Tasks 1A–E) aimed at providing essential information to begin Task 1F and optimize the experimental design of the first pharmacodynamic study. Recognizing that ‘orthotopic’ cancer models are inoculated into a particular liver lobe, we chose to verify the distribution of FDP-DOX in all four live lobes to ensure maximum access of FDP-DOX to the cancer bearing lobe (Figure 2, Task 1E).
Finally, the pharmacodynamic study (Figure 2, Task 1F) was designed to investigate the hypothesis that the presence of FDP-DOX-75 prior to Hep-3B-luc cell inoculation in the same site where FDP-DOX-75 had been deposited ahead of the inoculum, would not arrest, or interfere with cell proliferation or tumor formation. This “null hypothesis”, if rejected, expected to validate our hypotheses that FDP-DOX could serve as a promising drug delivery technology.
Evidence of preferential deposition of FDP-NV and FDP-DOX in livers of nude mice following IV injection
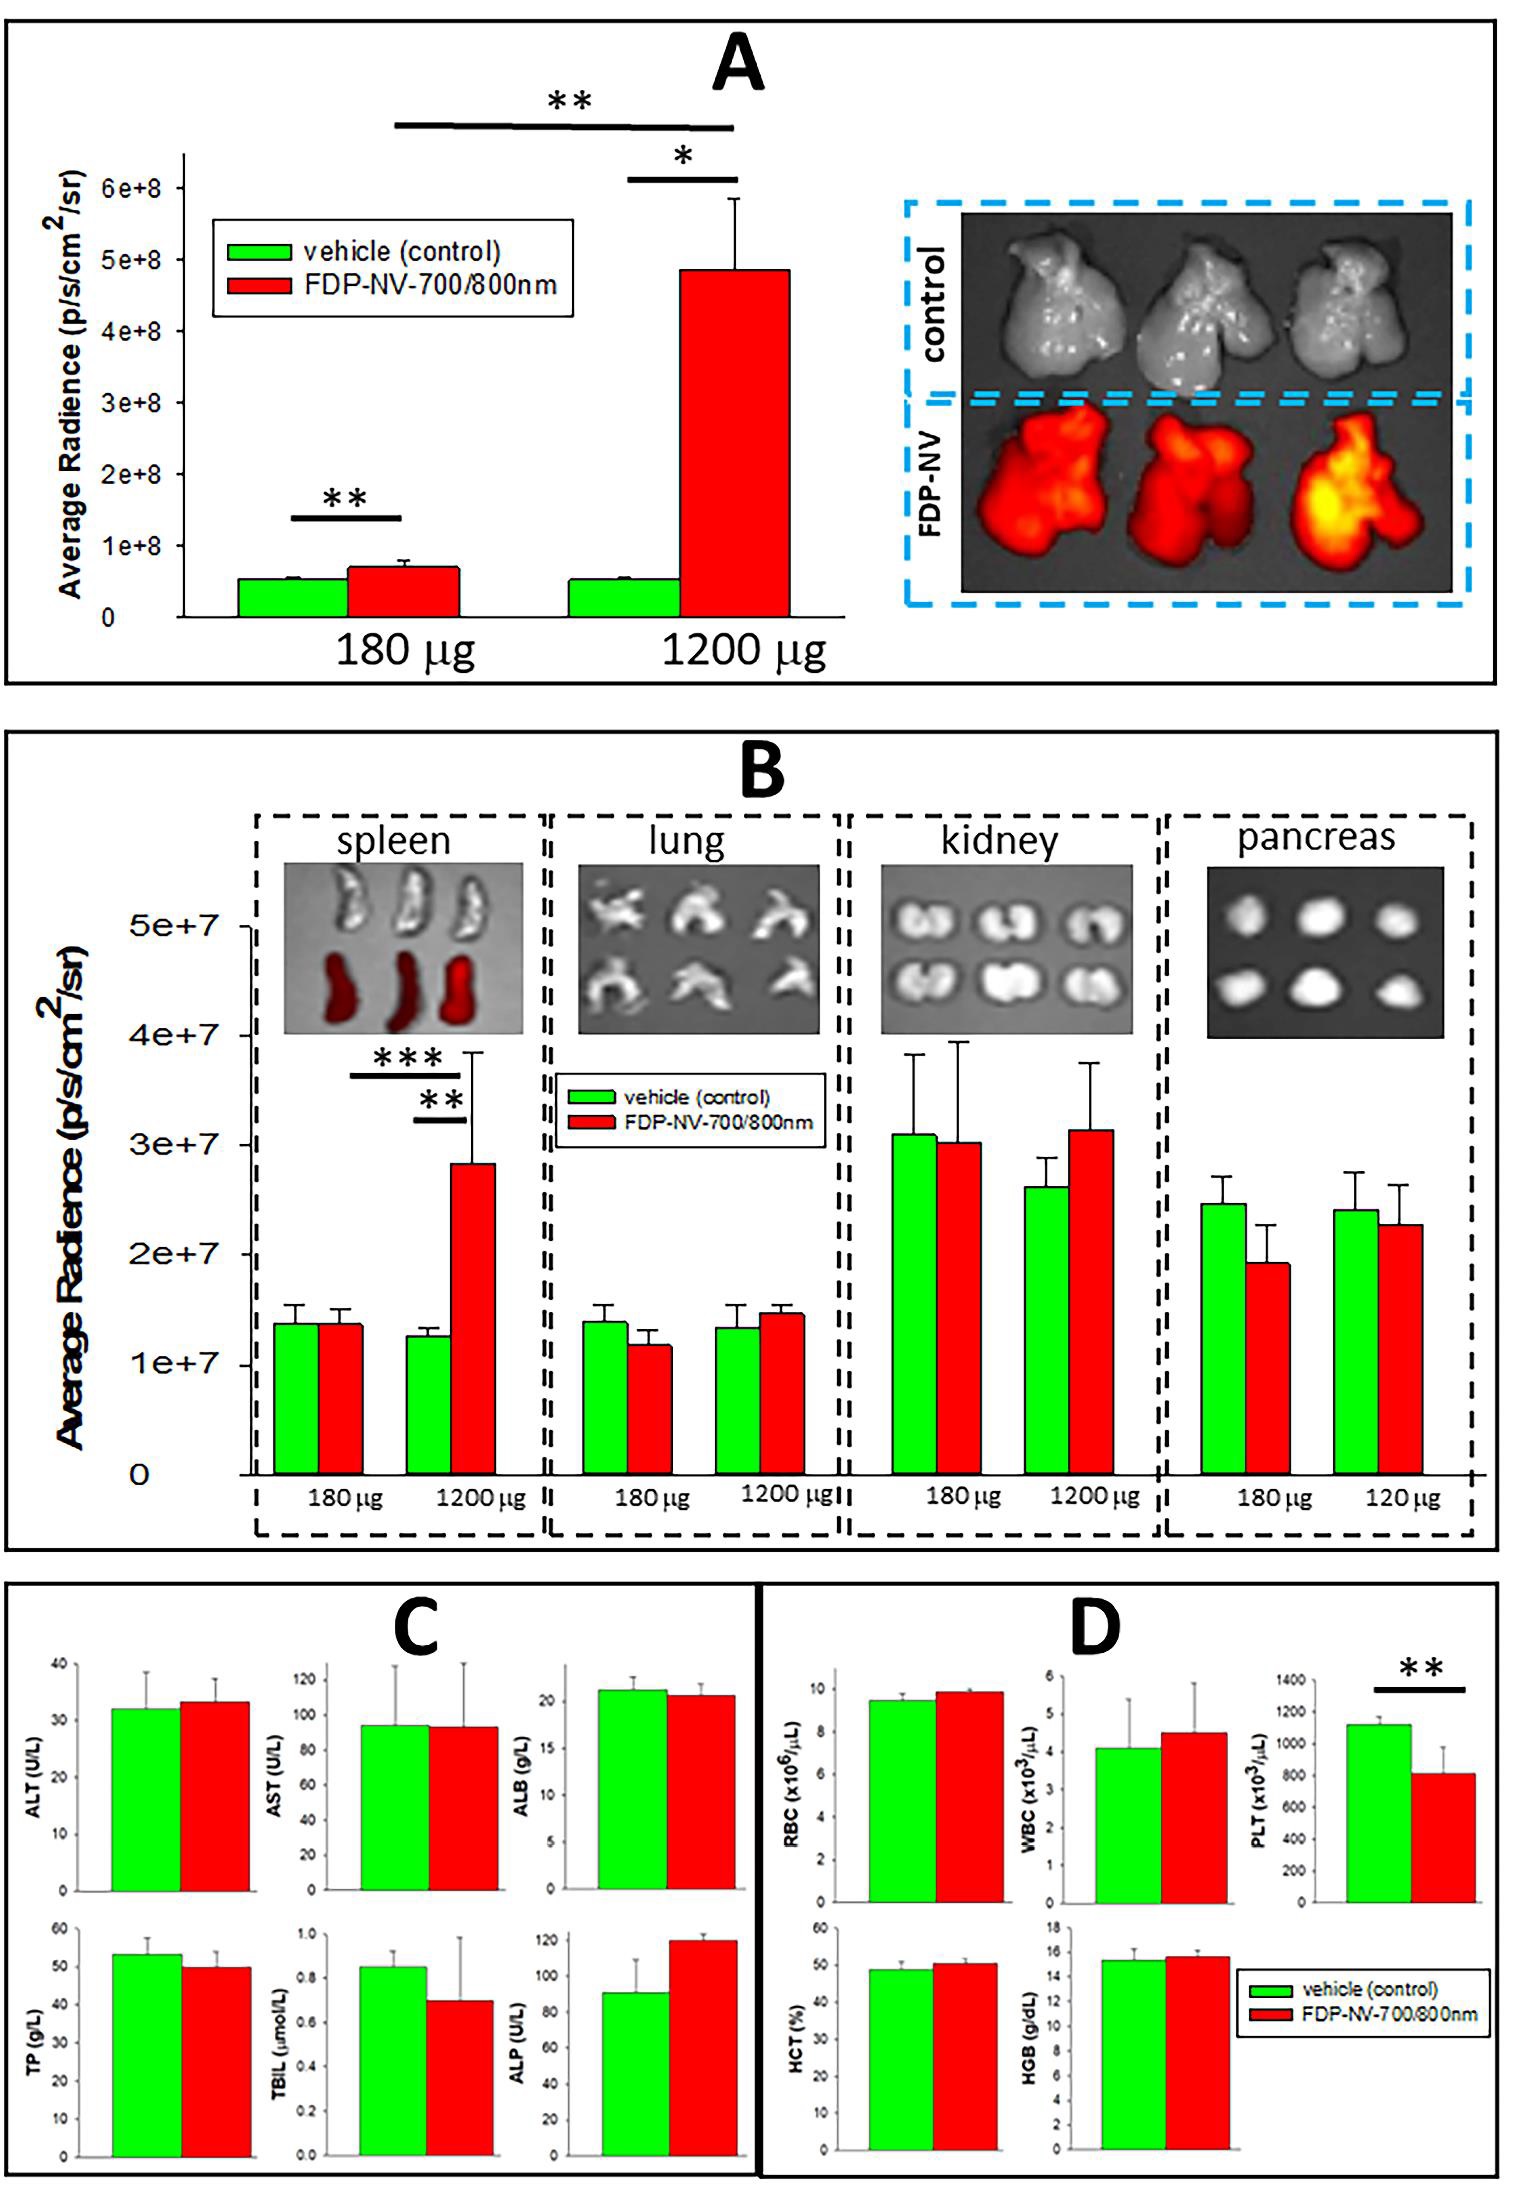
Figures 3–5 provide unequivocal data on preferential deposition of FDP-NV-700/800 nm (Figure 3) and FDPDOX (Figure 4) in the livers of nude mice after IV infusion of the respective particles. Figure 3A presents an exponential increase in high-dose particles deposition in livers over a low dose, while only a small fraction could be identified in the spleen only. Figure 3B presents a clear differential distribution of the high dose in the liver and signals recorded from lungs, kidney, and pancreas (upper panel). The latter observation is in line with our previous study in rats [36-38]. Calculation of percent distribution of the high dose of FDP-NV-700/800 nm in all listed organs (based on the proportional biofluorescence distribution) indicates a mean accumulation of 94.5% in the liver and only 5.5% in the spleen, and no detectable signal in the lungs, kidney, or pancreas. However, the caveat to this calculation is the method limitation in detecting weak signals due to exceptionally low depositions in other bodily organs where a minute mass of particles might still be deposited.
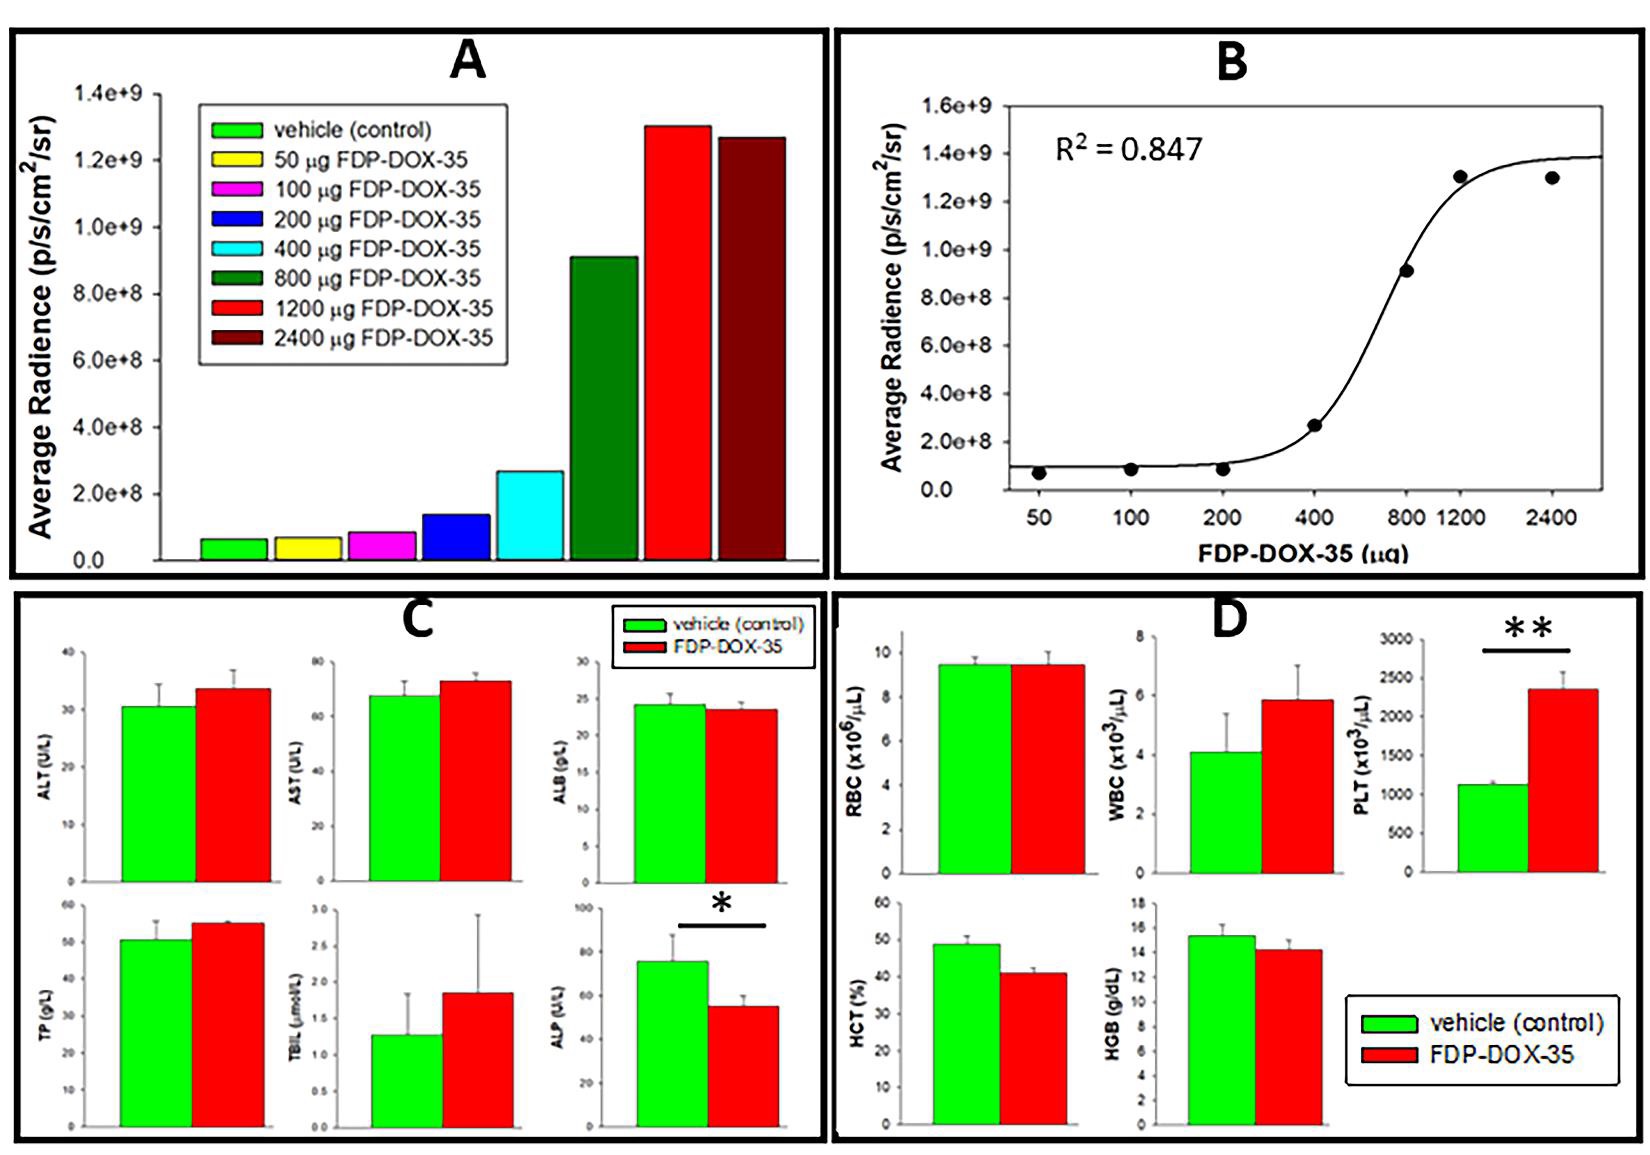
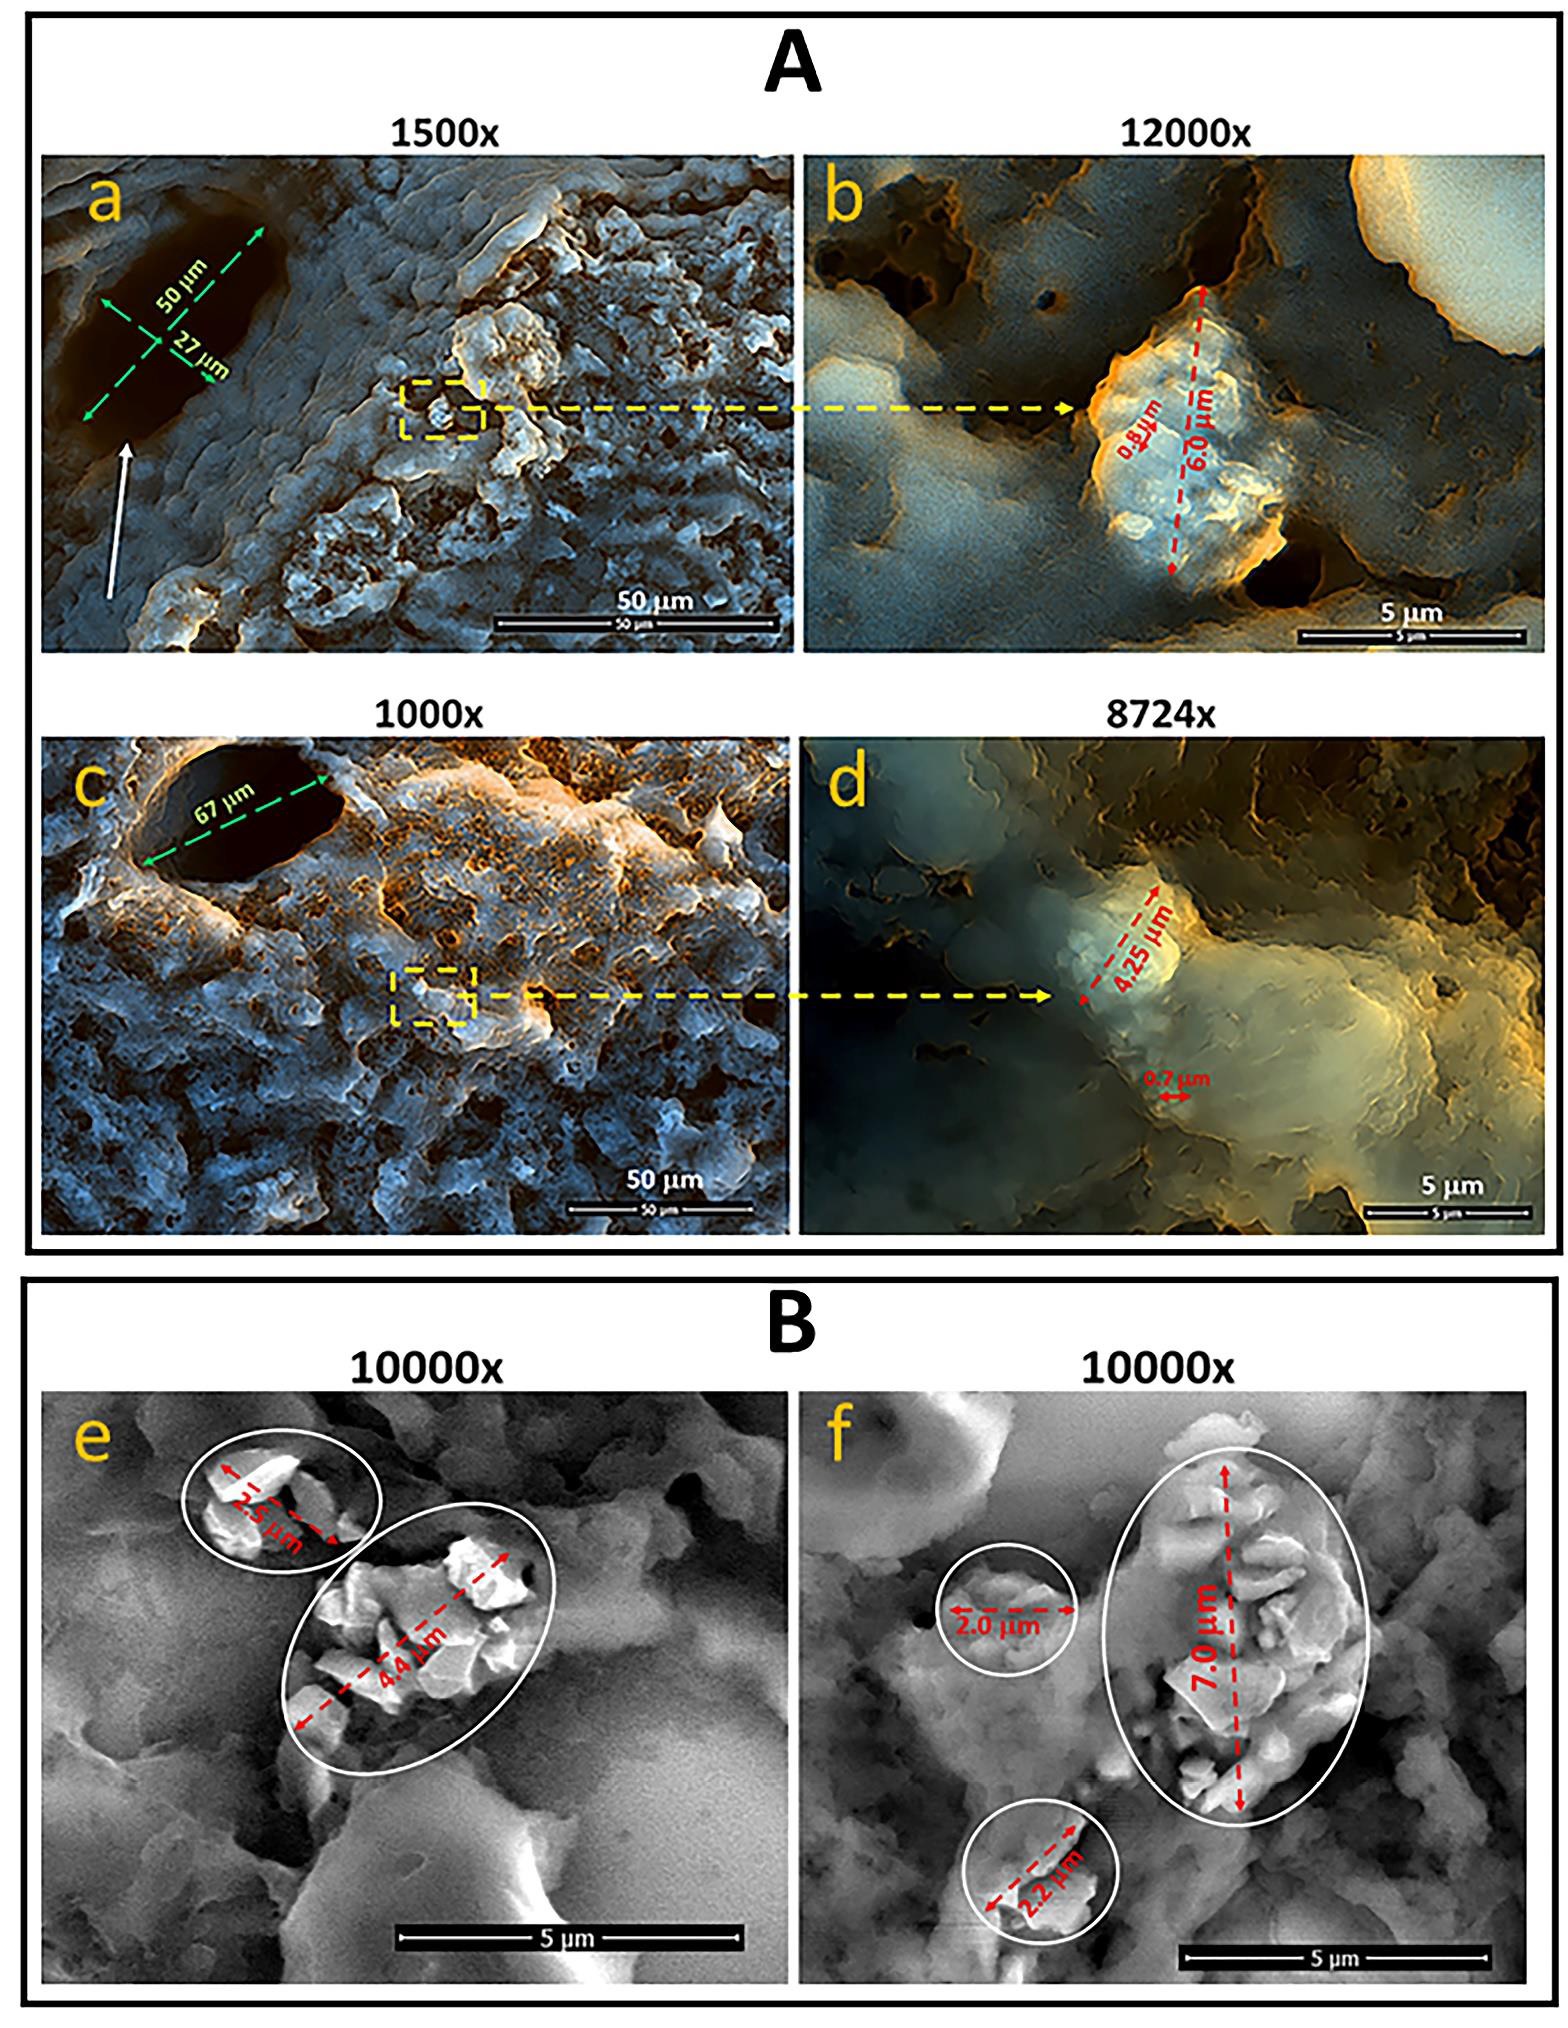
The dose-response study (Figure 4A and B) evaluated the ‘Maximum Retention Dose’ of the liver (MRD) and suggested that saturation of liver capacity to retain FDP-DOX is achieved at 2–3 mg/mouse. The distribution of FDP-DOX in the liver evaluated by SEM, provided evidence of deposition in liver sinusoids in the form of agglomerated clusters (Figure 5A). These, agglomerated clusters of FDP-DOX were unlikely due to the DOX coating per se as similar SEM data using naïve (non-coated) FDP-NV-700/800 nm been already reported in rats [38]. Figure 3C, D, and Figure 4C, D indicate normal liver function tests and hematology variables in both the vehicle control mice and particles injected mice. However, these studies were acute (blood samples collected after 5 days) and therefore long-term effects cannot be excluded.
Distribution of FDP-DOX-34/35 in Hep-3B-luc tumors induced in the livers of nude mice at a late stage of the cancer
At the beginning of the study the supplier provided only FDP-DOX-34/35 µg/mg FDP with limited coating capacity, which was used for the pilot studies. Upon production of FDP-DOX-75 µg/mg particles were used for Task 1F, the pharmacodynamic study. Figures 6–11 illustrate the dynamics of Hep-3B-luc-induced tumors in BALB/c mice over an acute (2 weeks), subacute (4 weeks), or late-stage (9 weeks) post-inoculation of Hep-3B-luc. These studies were aimed to determine whether the tumor stage was important for dosing regimens, particle distribution, and FDP-DOX access to tumors. Furthermore, probing tumorrelated impairments in LFT and key hematology variables was essential to define the safety margin of FDP-DOX in each stage of the tumor.
Figure 2: Translational medicine path towards proof of technical feasibility and proof of hypothesis. Six pilot studies were conducted consecutively to verify the preferential deposition of carriers per se, (FDP-NV-700/800 nm) in mice liver (Task 1A) and to probe the FDP-DOX-34 coating (Task 1B). In both tasks (1A and 1B) LFTs and hematological variables (CBC) were also evaluated on day six after exposure to FDP-NV-700/800nm per se. Task 1C aimed to determine the limits of the mouse liver to capture and retain FDP-DOX-34 to avoid 'spill-over' of the treatment in the systemic circulation. This latter task was performed at a later stage of orthotopic cancer to confirm the access of FDP-DOX-34 to the advanced stages of the tumor. Task 1D aimed to track the end stage of the model and validate the bioluminescence biomarker throughout its terminal course that requires euthanasia. Task 1D aimed to verify that FDP-DOX-34 gain access to the specific liver lobe where cancer cell inoculation will be conducted and Task 1F aimed to investigate whether the presence of FDP-DOX-34 in the initiation of tumor growth in the designated liver lobe.
Figure 3: Task 1 A: Distribution of FDP-NV-700 / 800 nm in the liver and auxiliary organs of mice 5 days after IV infusion. (A) NIR fluorescence of livers (n=3–5) recorded ex vivo after a single or double dose of FDP-NV-700/800 nm. The NIR fluorescence was measured by IVIS. Mice were infused (IV) with a single dose (180 µg of FDP-NV-700/800nm per mouse) or 1200 µg per mouse and livers were collected on day six after particle infusion. IVIS images (right) represent liver from a dose of 1200 γ (n=3). Error bars indicate the SD for five animals per 180 µg group (n=5) and three animals per 1200 µg group (n=3), (*) P< 0.001 and (**) P<0.01 calculated using one-way ANOVA. (B) Fluorescence imaging of four organs (spleen, kidneys, lungs, and pancreas). The deposition of particles in the spleen was clearly observed beyond control but only after a high dose. The NIR fluorescence of the high dose observed in the spleen was on average 1.25x10⁷ compared to 5x10⁸ in the liver treated with the same dose. Error bars indicate the SD for five animals per single dose group (n=5) and three animals per double dose group (n=3), (**) P<0.01 and (***) P<0.05 calculated using one-way ANOVA. The images above bar graphs present organs treated (bottom rows) or not treated (upper rows) with FDP-NV-700/800 nm. (C) Effect of FDP-NV-700/800 nm on liver function tests assayed in plasma collected under anesthesia at the end of the experiment (day 5 after treatment at 180 µg/mouse (n=5)). The bars show the mean value of three mice and the error bars represent SD. No statistical differences were observed between the treated and control mice on any of the parameters. (D) Effect of FDP-NV-700/800 nm on selected blood variables. Mice were injected (IV) with 1200 µg of FDP-NV-700/800 nm per mouse and blood was collected on day five after injection. Green bars represent means of vehicle control, and red bars represent means of treated mice. SD for four animals per control group (n=4), and five animals for the group treated with particles (n=5). (**) P<0.01 calculated using one-way ANOVA.
Figure 4: Dose-dependent accumulation of FDP-DOX-35 in the liver of nude mice to establish maximum retention dose (MRD). (A) Retention of FDPDOX-35 in the livers (via NIR) of separate groups of mice subjected to escalating dosing regimens (by IV) as noted in the legend box (color coded). NIR was monitored ex vivo on day five after infusion of particles. (B) A cumulative NIR fluorescence (by IVIS) of isolated livers obtained on day five after particle infusion. The plot was evaluated based on the equation for standard curves (R2=0.847), a four-parameter logistic curve (prepared using SigmaPlot software). (C) Liver function tests and (D) hematology variables, respectively, in mice subjected to vehicle controls (green bars, n=4) or FDP-DOX-34 (red bars, n=3) treated with the highest dose, 1.2 mg/mouse. Mice were anesthetized on day five after treatment and blood was collected for LFT and CBC analysis. (*) P<0.05), (**) P<0.001 (n=3), calculated using one-way ANOVA.
Late-stage tumors
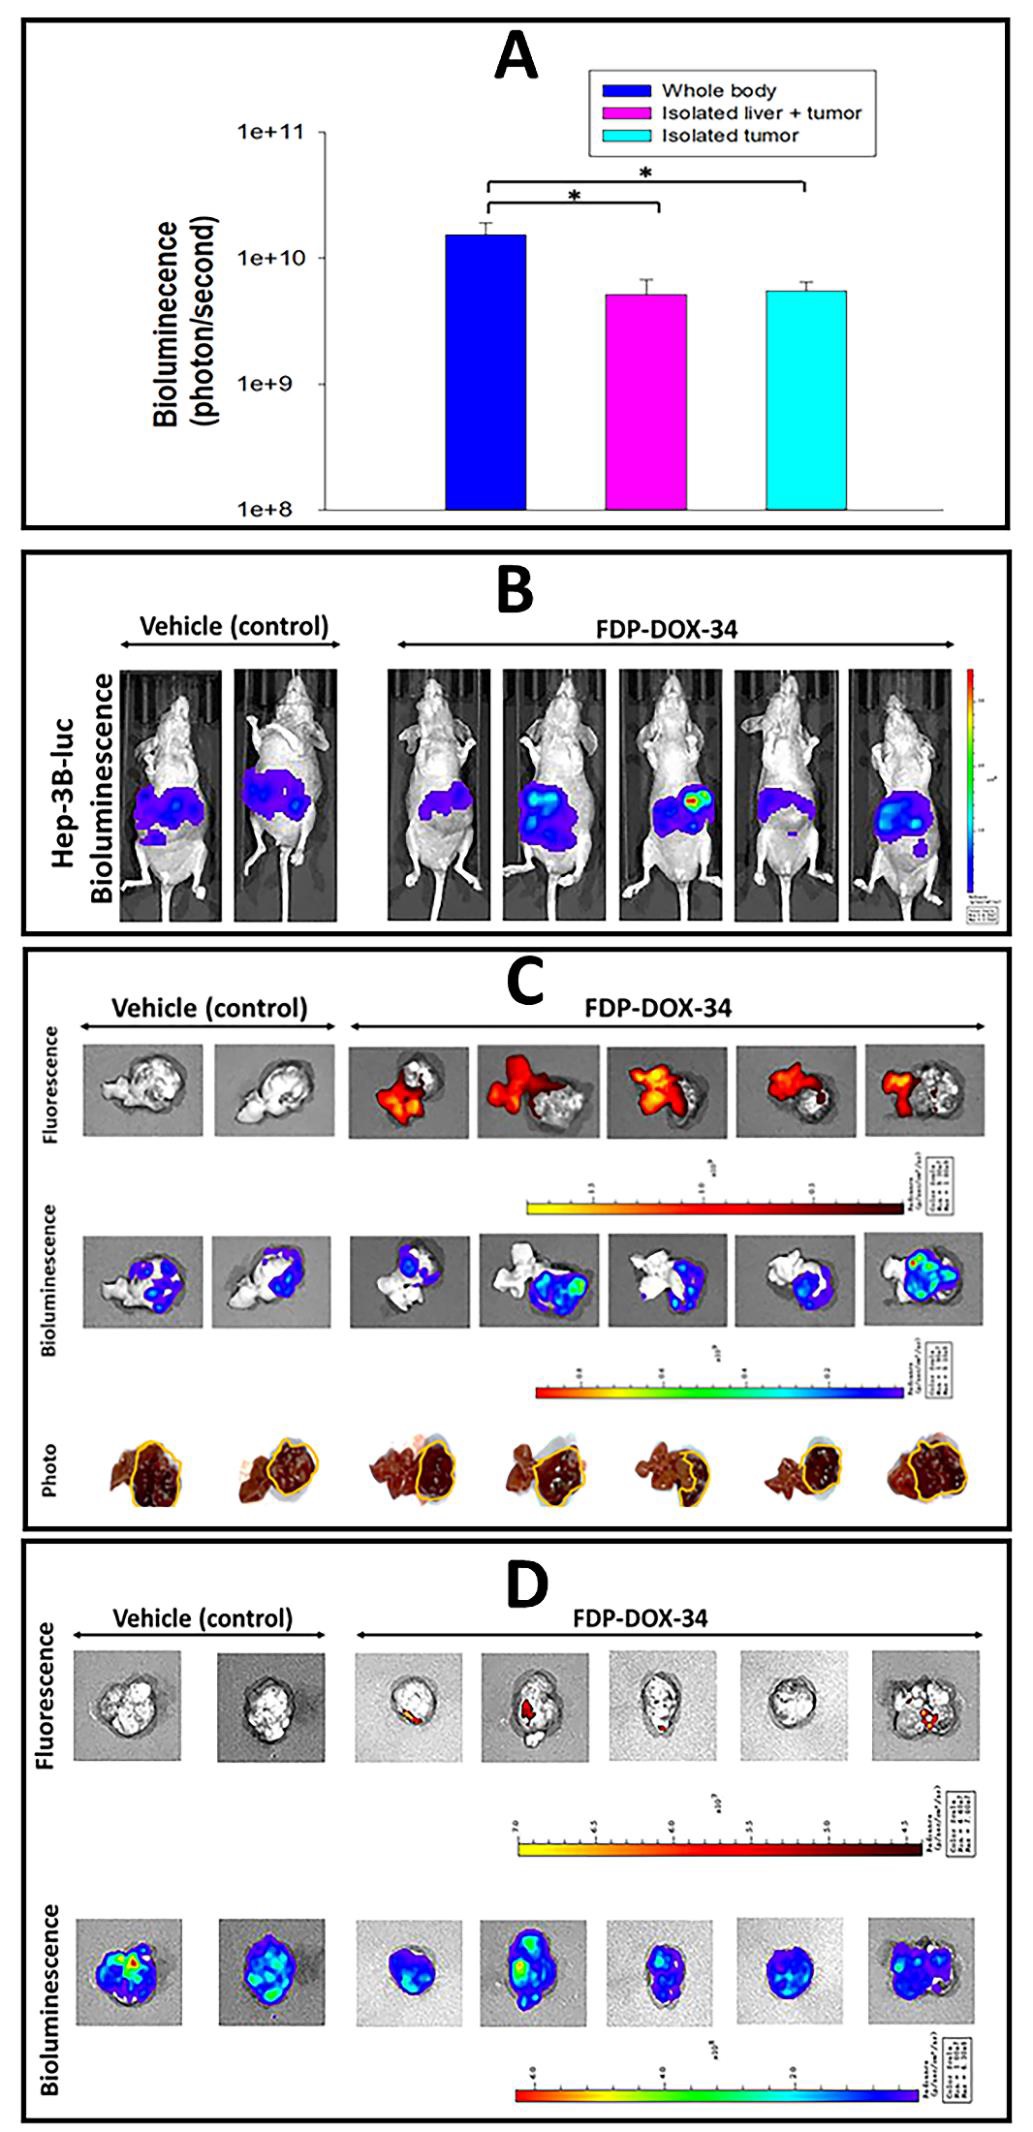
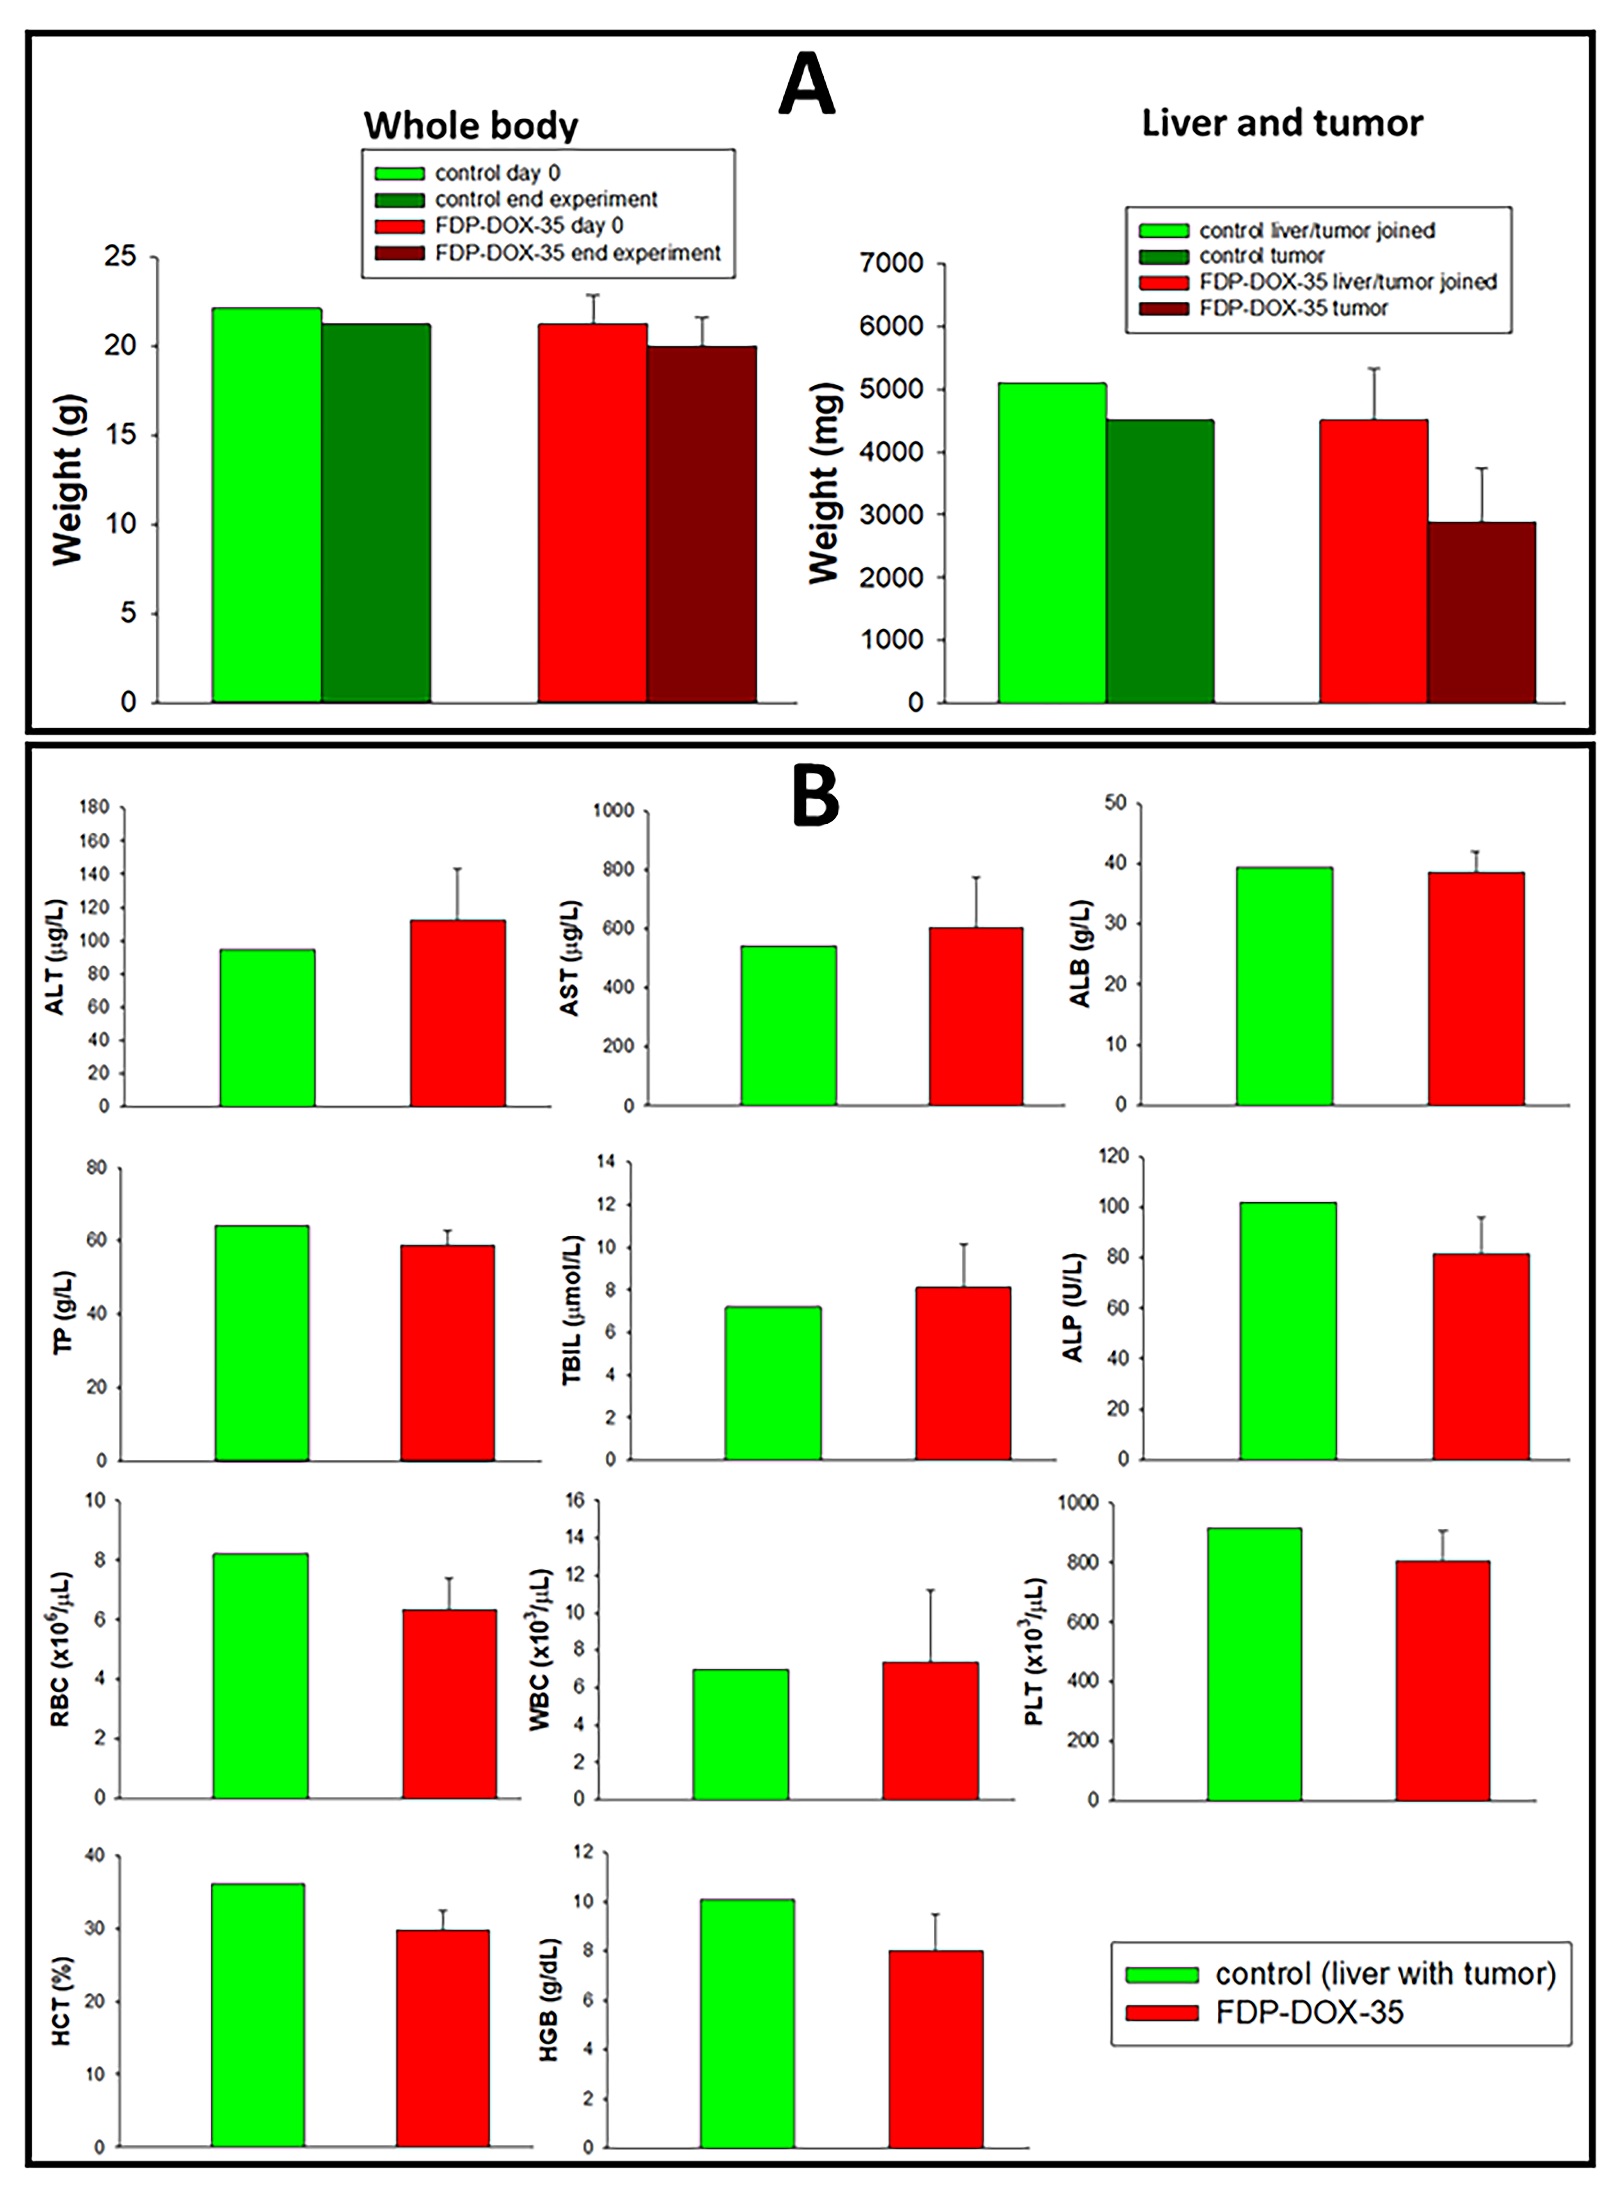
Late stages (grades III–IV) of liver metastases are characterized by high mortality and frequent resistance to contemporary treatments. Therefore, our aim was to establish a model to investigate these properties as a priority for targeted treatment. Figures 6–8 characterize latestage tumor development up to 9 weeks after Hep-3B-luc inoculation in the left lobe of the liver. The in vivo dynamics of tumor development were assessed indirectly by wholebody biofluorescence and at the end of the experiments compared to isolated livers (ex vivo) via NIR fluorescence. Furthermore, following the imaging of tumor-bearing livers, the tumors were excised under imaging and captured for more direct assessment of FDP-DOX-35 pharmacodynamics effects and confirmation of particles location. Figure 6A illustrates the whole-body bioluminescence of all tumorbearing mice leading to large tumors, which corresponds directionally to the ex vivo imaging of the tumor-bearing livers (Figure 6B). Ex vivo fluorescence imaging of the livers confirmed the presence of particles in the livers of all FDPDOX-35 treated mice (Figure 6B, upper panel) but tumors excised from the livers (panel A) failed to produce consistent bioluminescence signals (Figure 6C). A few minor ‘red spots’ were observed in two isolated tumors, which are likely residual liver tissue still associated with the excised tumor (Figure 6C, upper panel). Figure 7 presents biochemical functions of the late-stage Hep-3B-luc tumors, suggesting preservation of LFT and normal CBC at this late stage. However, two mice in the control group had already been assigned to euthanasia due to evidence of systemic signs of ascites (data not shown).
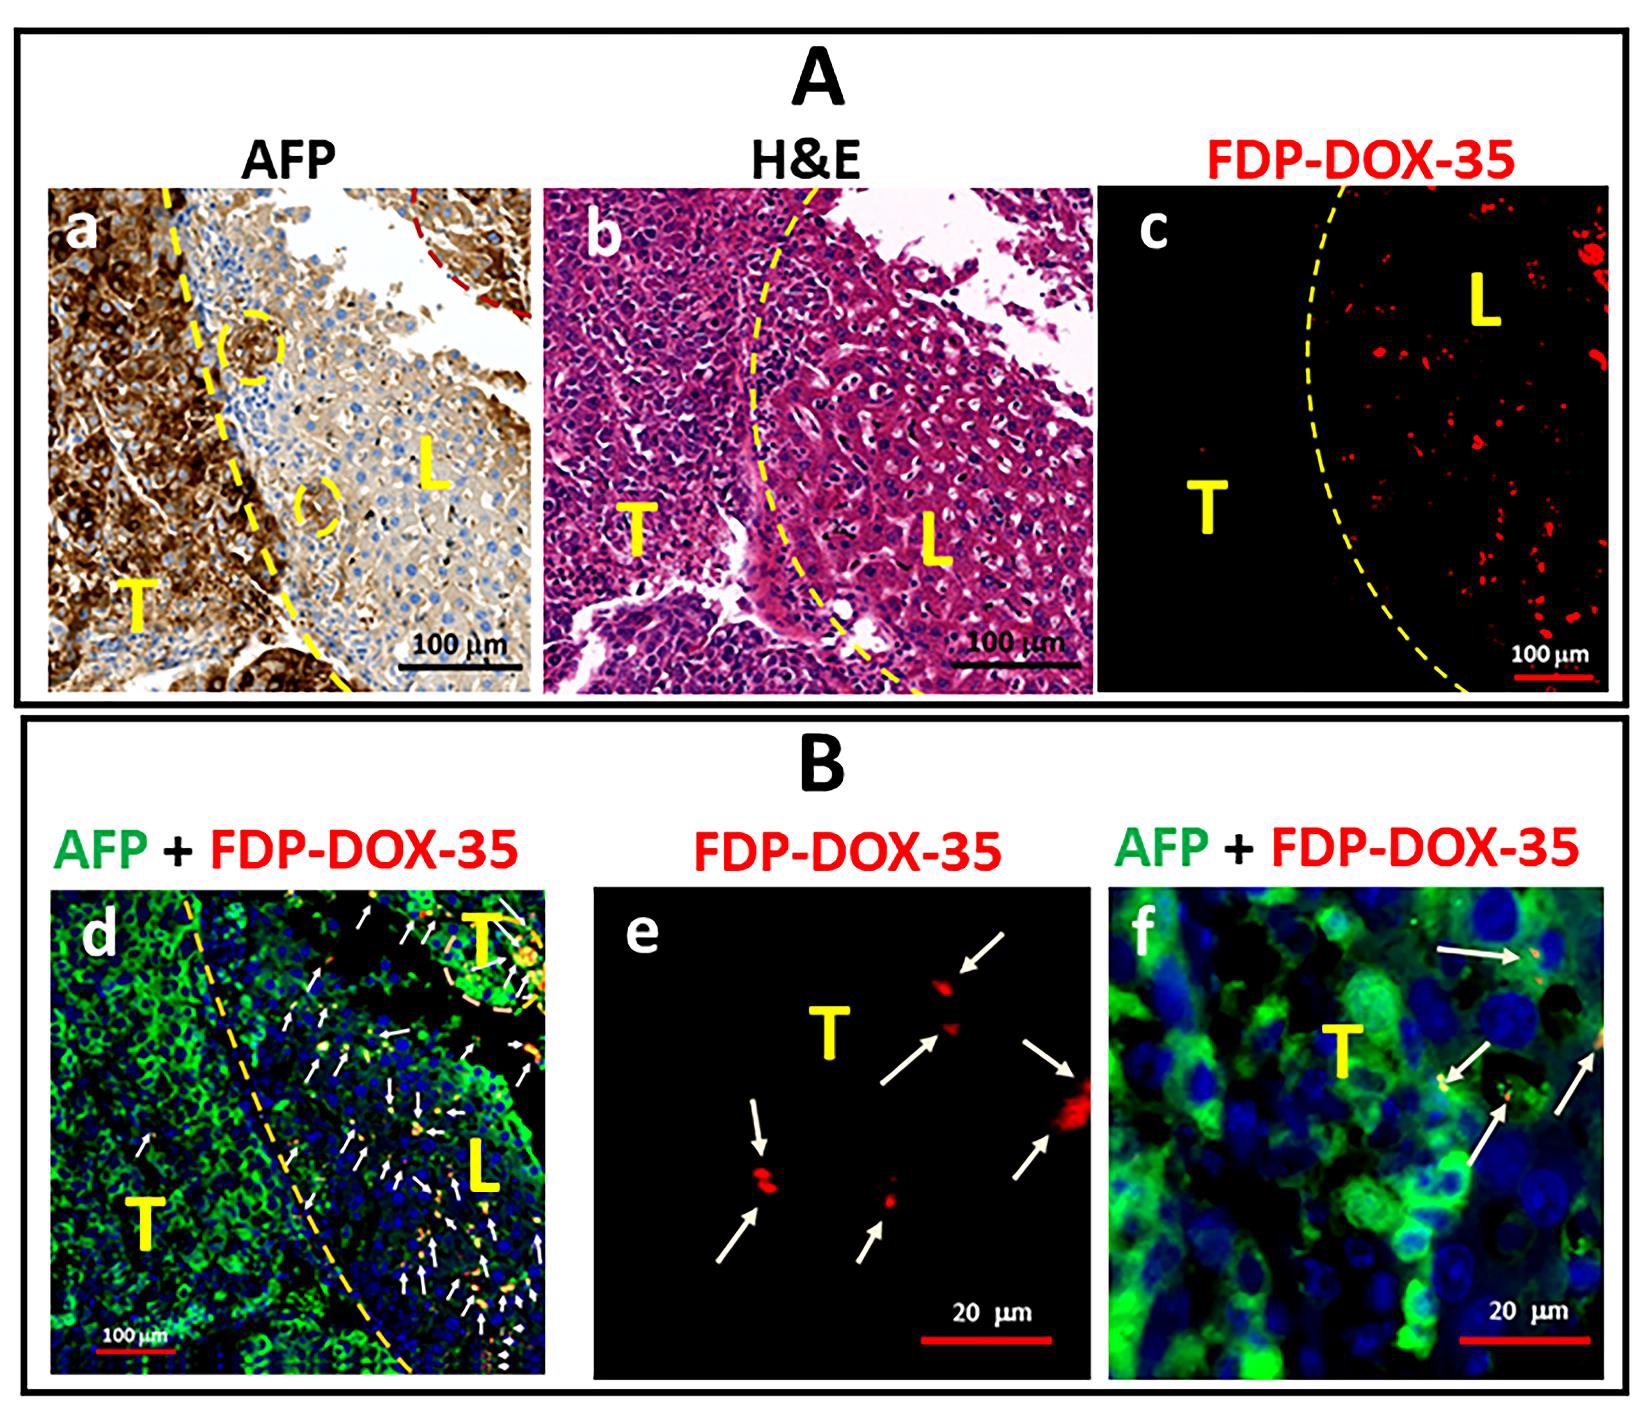
Figure 8 provides histological and immunohistochemical data on the distribution of particles (FDP-DOX-35) in late stage Hep-3B-luc tumors in nude mice. Clear differences in the distribution of particles in liver tissue in marked contrast to tumor tissue (the latter stained with fluorescence AFP antibodies) as illustrated by the yellow dashed line, which distinguished the tumor cells (Figure 8A, upper left panel) from liver cells stained with H&E (Figure 8A, middle of upper panel). Fluorescence microscopy revealed the dense presence of particles in the liver zone (Figure 8A (c), B (d) yet only few were present in the tumor zone. A detailed search for particles in tumor tissue by 5-fold magnification (Figure 8B, bar code 20 µm) using AFP-stained (green) zone (Figure 8B(d)) and fluorescence microscopy (Figure 8B(e) revealed few NIR signals (particles) in the tumor zone where cancer cells were more dispersed (Figure 8B (f), AFP green marked by white arrows).
Taken together, the above findings provide strong evidence of the primary distribution of FDP-DOX in liver tissue and only minimal in the tumors’ zones. These histochemical data validate the lack of ex vivo NIR luminescence of tumors outside the livers shown in Figure 6D (upper panel).
Figure 5: Scanning electron microscope (SEM) images of the liver of mice and rats treated with FDP-DOX-34 and FDP-NV-BSA. (A) Mouse were treated with 0.8 mg of total FDP-DOX-34 in two equal doses and liver was isolated on day five after injection. The surface of fixed liver tissue slices was analyzed using SEM at different magnifications (indicated above each image). Framed areas on lower magnification (yellow dashed lines) indicate images taken at higher magnifications. The diameters of the FDP-DOX-34 clusters are marked with red dashed arrows. Diameters of a single FDP-DOX-34 selected are indicated by red arrows. The white arrow indicates the central vein. (a, b) and (c, d) represent different images under different magnifications. (B) Rats were treated with FDP-NV-BSA (60 mg/kg), and the experiment was conducted at 14 days, as previously described. Twenty-one 5-µm-thick paraffin sections were analyzed after deparaffinization. Framed areas indicate the location of particles in liver tissue. The diameters of the FDP-NV-BSA clusters are marked by red dashed arrows. (e, f) Different images under the same magnification.
Figure 6: Distribution of FDP-DOX-34 in the liver and tumors in late stage orthotopic cancer models in nude mice. Hep-3B-luc cells were orthotopically inoculated in mice and tumors were allowed to grow for 64 days. On day sixty-five, FDP-DOX-34 was injected intravenously at a dose of 1.2 mg in 0.45 mL per mouse. A second (same) dose of FDP-DOX-34 was injected after 24 hours (day 66), and the mice were scarified on day sixty-six, the end of experiment. (A) Comparison of the intensity of bioluminescence of the whole-body, isolated liver-bearing tumor, and separated tumor of mice treated with FDP-DOX-34. Error bars represent SEM from seven animals (n=7), (*) P<0.05 calculated using one-way ANOVA. (B) Images of whole-body bioluminescence. (C) Images of tumor-bearing livers (upper panel) by fluorescence (IVIS). Images by bioluminescence of all inoculated tumor-bearing mice are presented in the middle panel; photographic images of ex vivo tumors (lower panel) with yellow lines framing the tumors per se. (D) Images of tumors separated from livers for illustration of the fluorescence and bioluminescence of the particles of the tumors.
Figure 7: Body and tumor weights, liver function tests and selected blood variables of nude mice with experimental Hep-3B-luc cells-induced hepatocarcinoma. Hep-3B-luc cells were orthotopically inoculated into mice and the tumor was allowed to grow for 64 days. On day forty-five, FDP-DOX-34 was injected intravenously at 1.2 mg in 0.45 mL of PBS per mouse. The same dose was repeated after 24 hours (day 66). Blood was collected and the mice were scarified after another 24 hours (day sixty-six, end of the experiment). (A) The body weights of the mice were measured at the beginning of the experiment (day 0) and the end point of the experiment of euthanized animals (day 66). Bars present body weights of control animals with developing tumor (n=2) and mice with developing tumor treated with FDP-DOX-35 (n=5). (B) Liver function and blood parameters were measured by standard procedures. The error bars indicate SD for control mice that were not subjected to tumor inoculation (n=10; data obtained from vendor), and mice with developed tumor and treated with FDP-DOX-35 (n=5). The values for control mice with developed tumors are presented as a mean of two animals (n=2).
Figure 8: Representative images of paraffin sections of Hep-3B-luc tumors and liver tissue of mice treated with FDP-DOX-35 in the late-stage study. The paraffin sections were stained with AFP and H&E for colorimetric imaging and green fluorescence AFP and DAPI for fluorescence imaging. Fluorescence FDPDOX-35 is shown in red. The border between the tumor and normal liver tissue is shown by yellow or pink dashed lines. White arrows indicate accumulated clusters of particles. (A) Colorimetric presentation of images immuno-stained with AFP (a), with H& E (b) and red fluorescence identifying FDP-DOX-35 (c). (B) Fluorescence images presenting merged colors of immuno-stained with AFP (green), DAPI (blue), and FDP-DOX-35 (red) of normal and tumor tissue (d); single red color identifying accumulation of accumulation of FDP-DOX-35 in tumor (e); merged colors of immuno-stained with AFP (green), DAPI (blue), and FDP-DOX-35 (red) of normal and tumor tissue (f).
Dynamic progression of Hep-3B-luc-induced orthotopic tumors in nude mice at earlier stages post-inoculation
The paucity of FDP-DOX in late-stage (9 weeks) tumors, supported by two independent methods, prompted studies aimed at characterizing the earlier stages of orthotopic Hep3B-luc liver tumors. Figures 9–11 describe tumor progression over 28 days, where a weekly assessment of separate groups of mice monitored by whole-body bioluminescence and verified by ex vivo imaging of tumors that carried by livers using bioluminescence and photographic data.
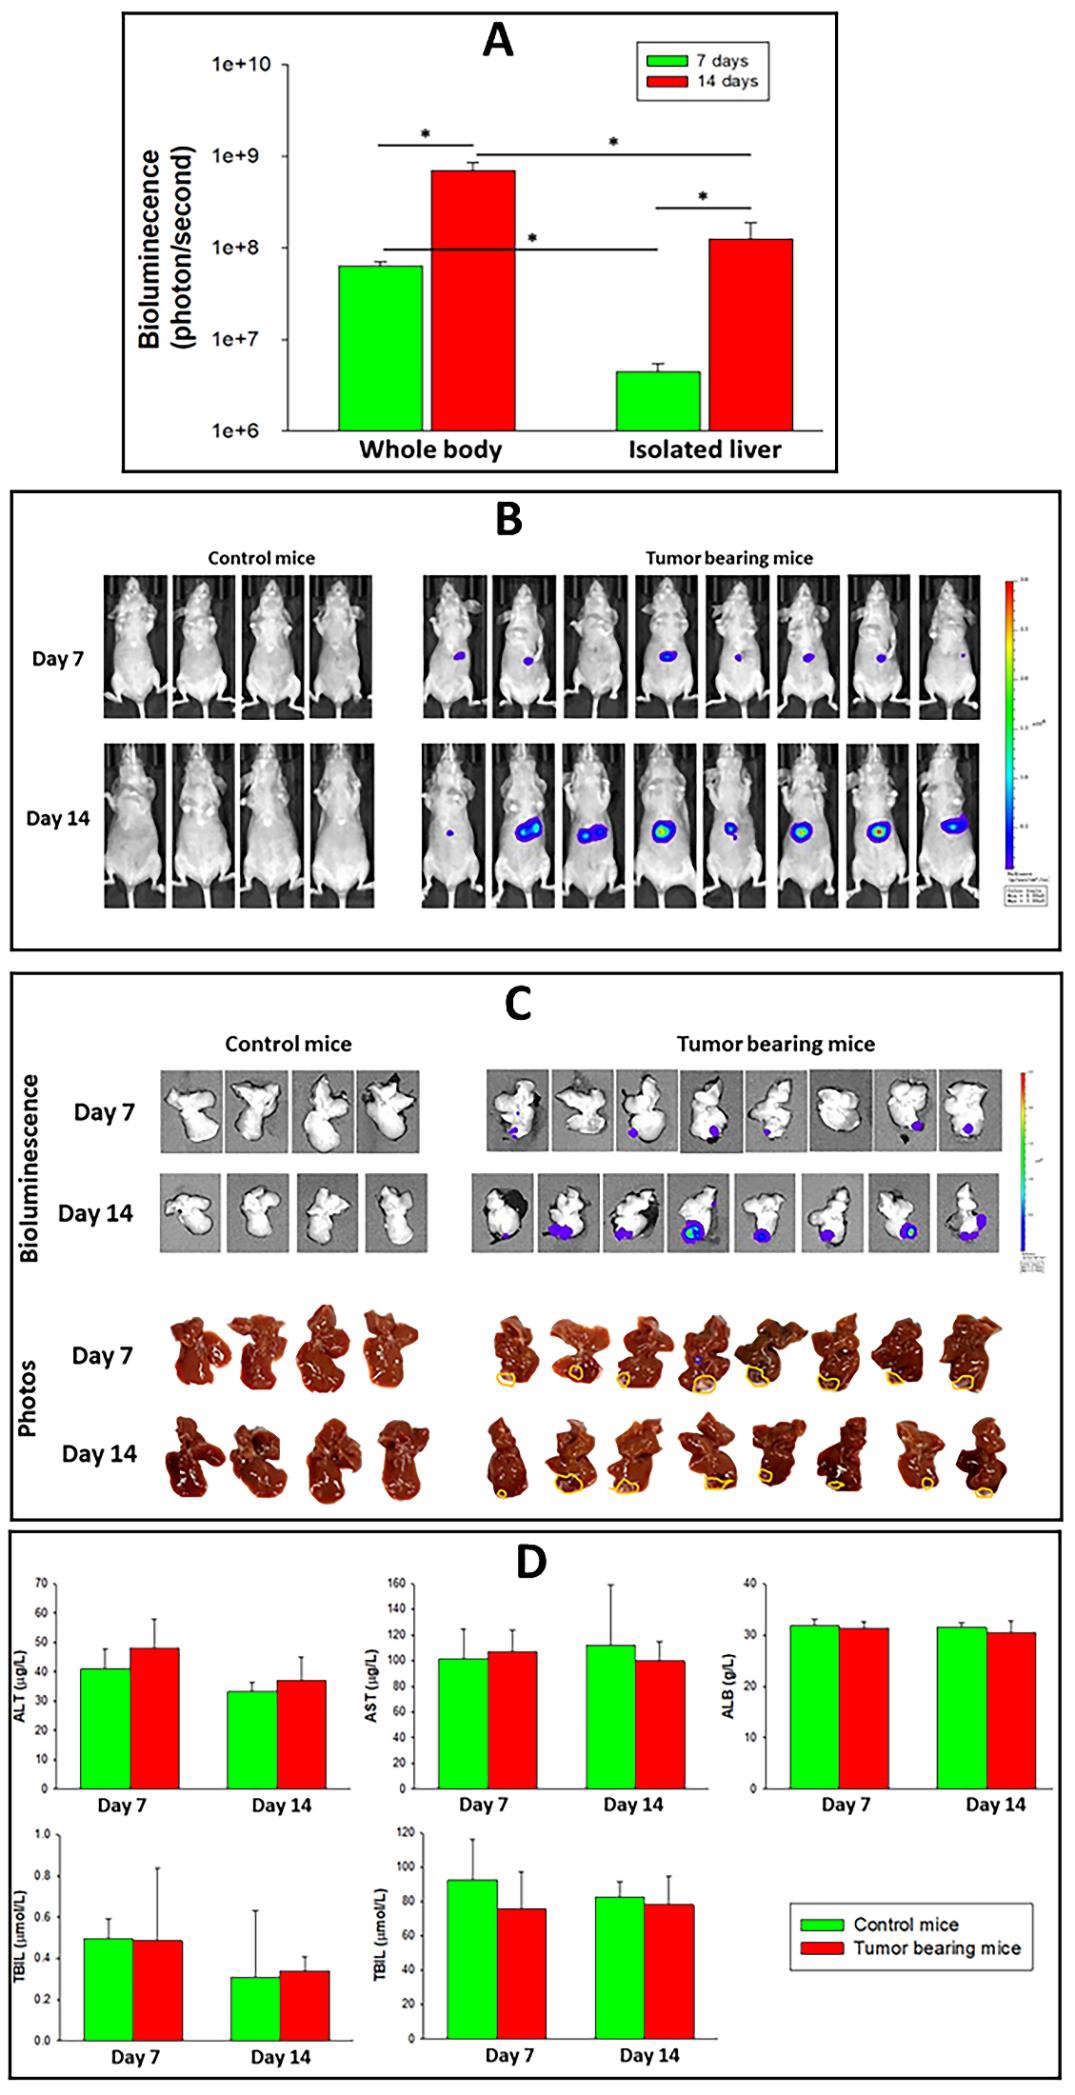
Figure 9A presents the bioluminescence of tumors monitored on days 7 and 14 after Hep-3B-luc inoculation. It is of interest to note that the whole-body bioluminescence on either day 7 or 14 is more robust than the bioluminescence of isolated livers at the same timepoints. Considering that inoculation of cells was directed to the liver equal bioluminescence was expected by either method (in vivo or ex vivo). However, whole-body bioluminescence on day seven was 2.5 times that of ex vivo on day seven, according to Figure 9B, C. Furthermore, ex vivo luminescence on day fourteen was three times that of day seven, while total body bioluminescence on day fourteen was only 30% higher than day seven. We cannot provide an explanation for this peculiarity except for the possibility that over time needed for the ex vivo imaging, cell viability, or luciferase enzyme activity deteriorated. Figure 9D provides data indicating preservation of LFT (on days 7 and 14) despite substantial tumor growth according to the photographic data (Figure 9D).
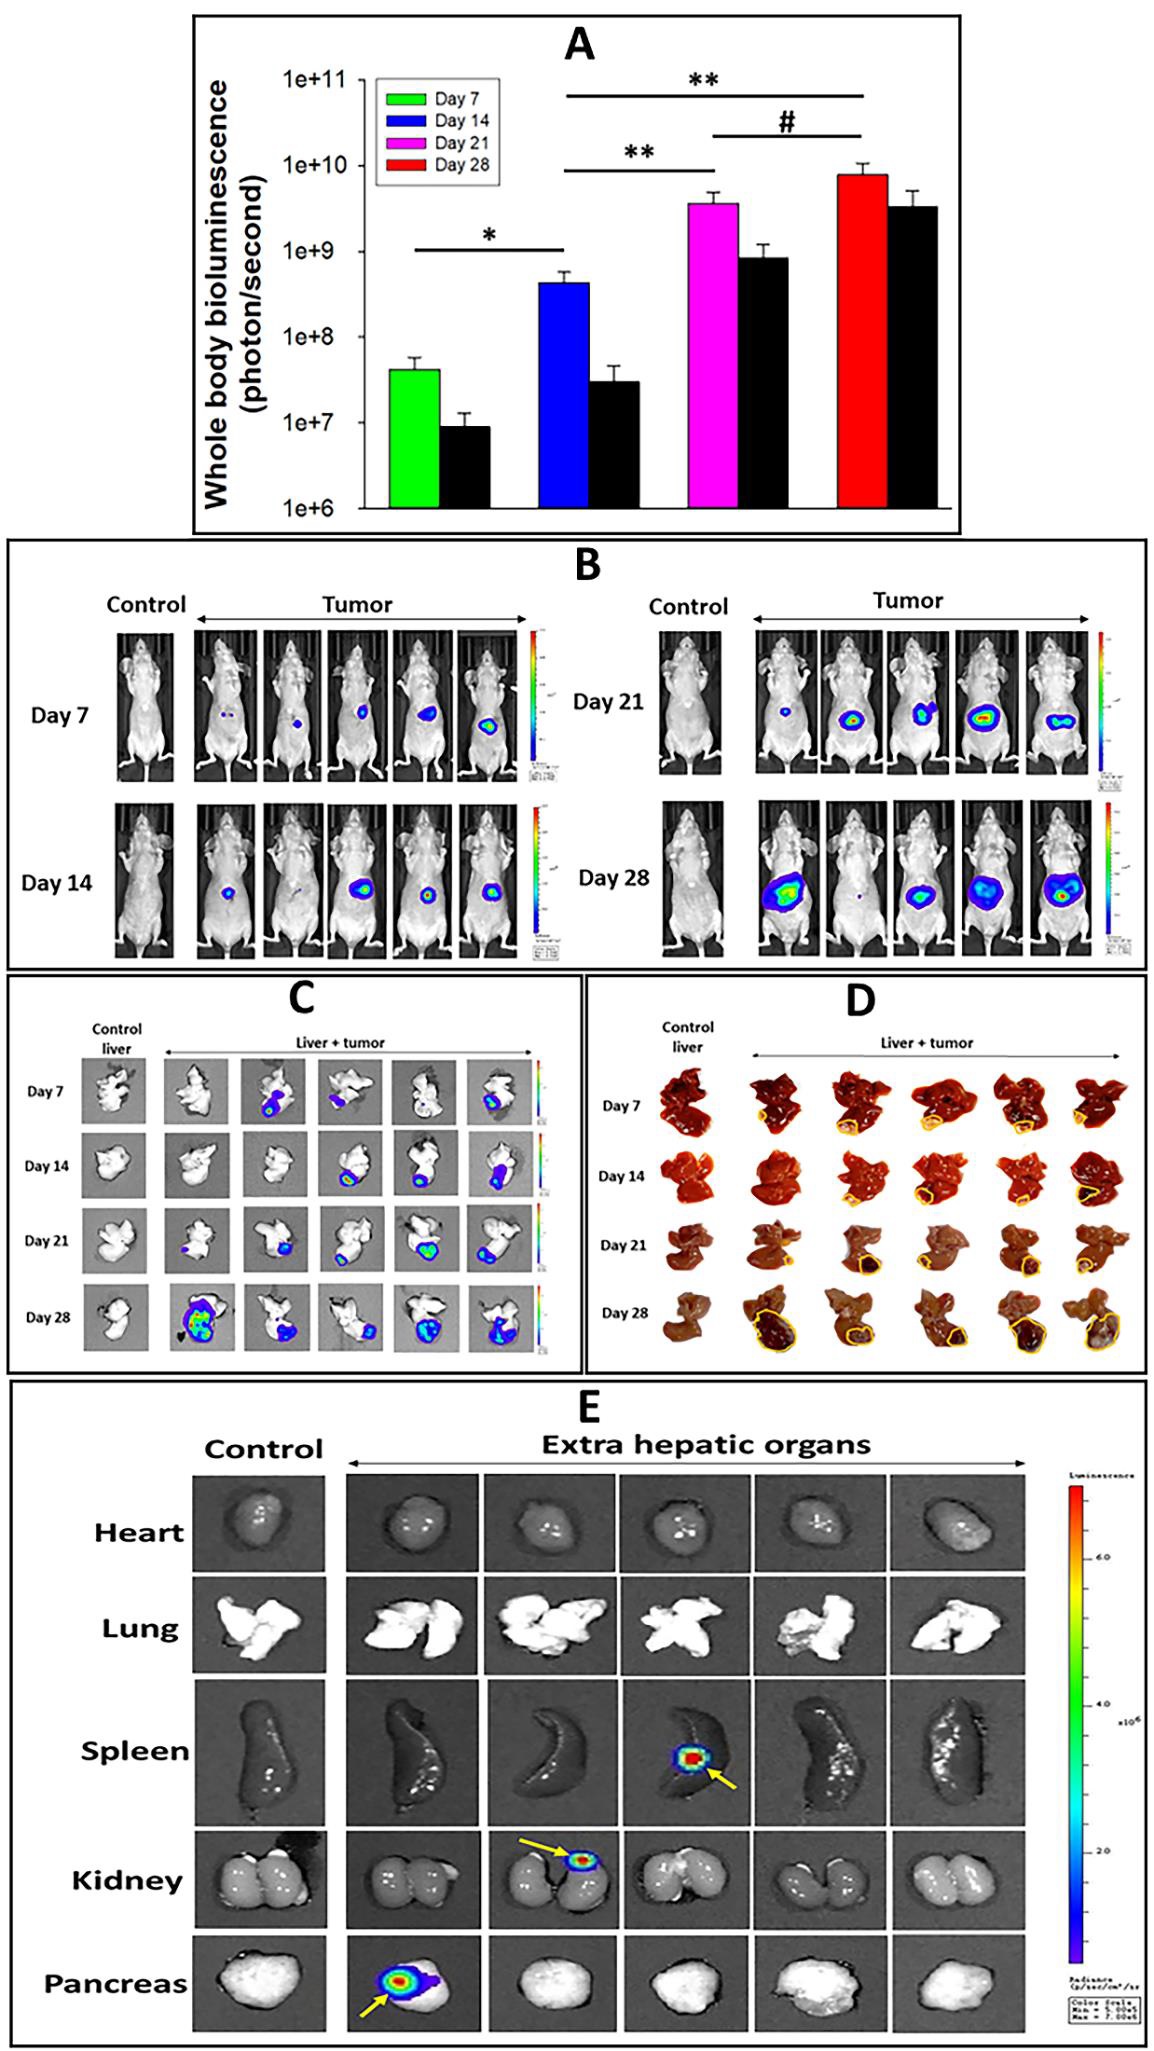
Figure 10 provides an extended time course (28 days, subacute) of Hep-3B-luc tumor development followed by similar protocols exercised in Figure 9. Figures 10A, B, present whole-body bioluminescence of tumor progression supported by ex vivo liver imaging (Figure 10C, D). As observed in the early-stage study (1 and 2 weeks), liver bioluminescence tracks directionally with total body bioluminescence, yet at lower intensity in the earlier periods (1 and 2 weeks) but less so in the later part, weeks 3 and 4. The reason for the delay in tumor growth has not been explored. It should also be noted that two mice studied to the third and fourth weeks (Figure 10B) showed questionable whole-body bioluminescence, but the same mice had robust signals when their livers were imaged ex vivo; however, inspection of photographic data for visible tumor extension from the liver (Figure 10D). Taken together, these data strongly suggest the need to apply different methods to validate the presence of tumors by bioluminescence beyond whole-body bioluminescence.
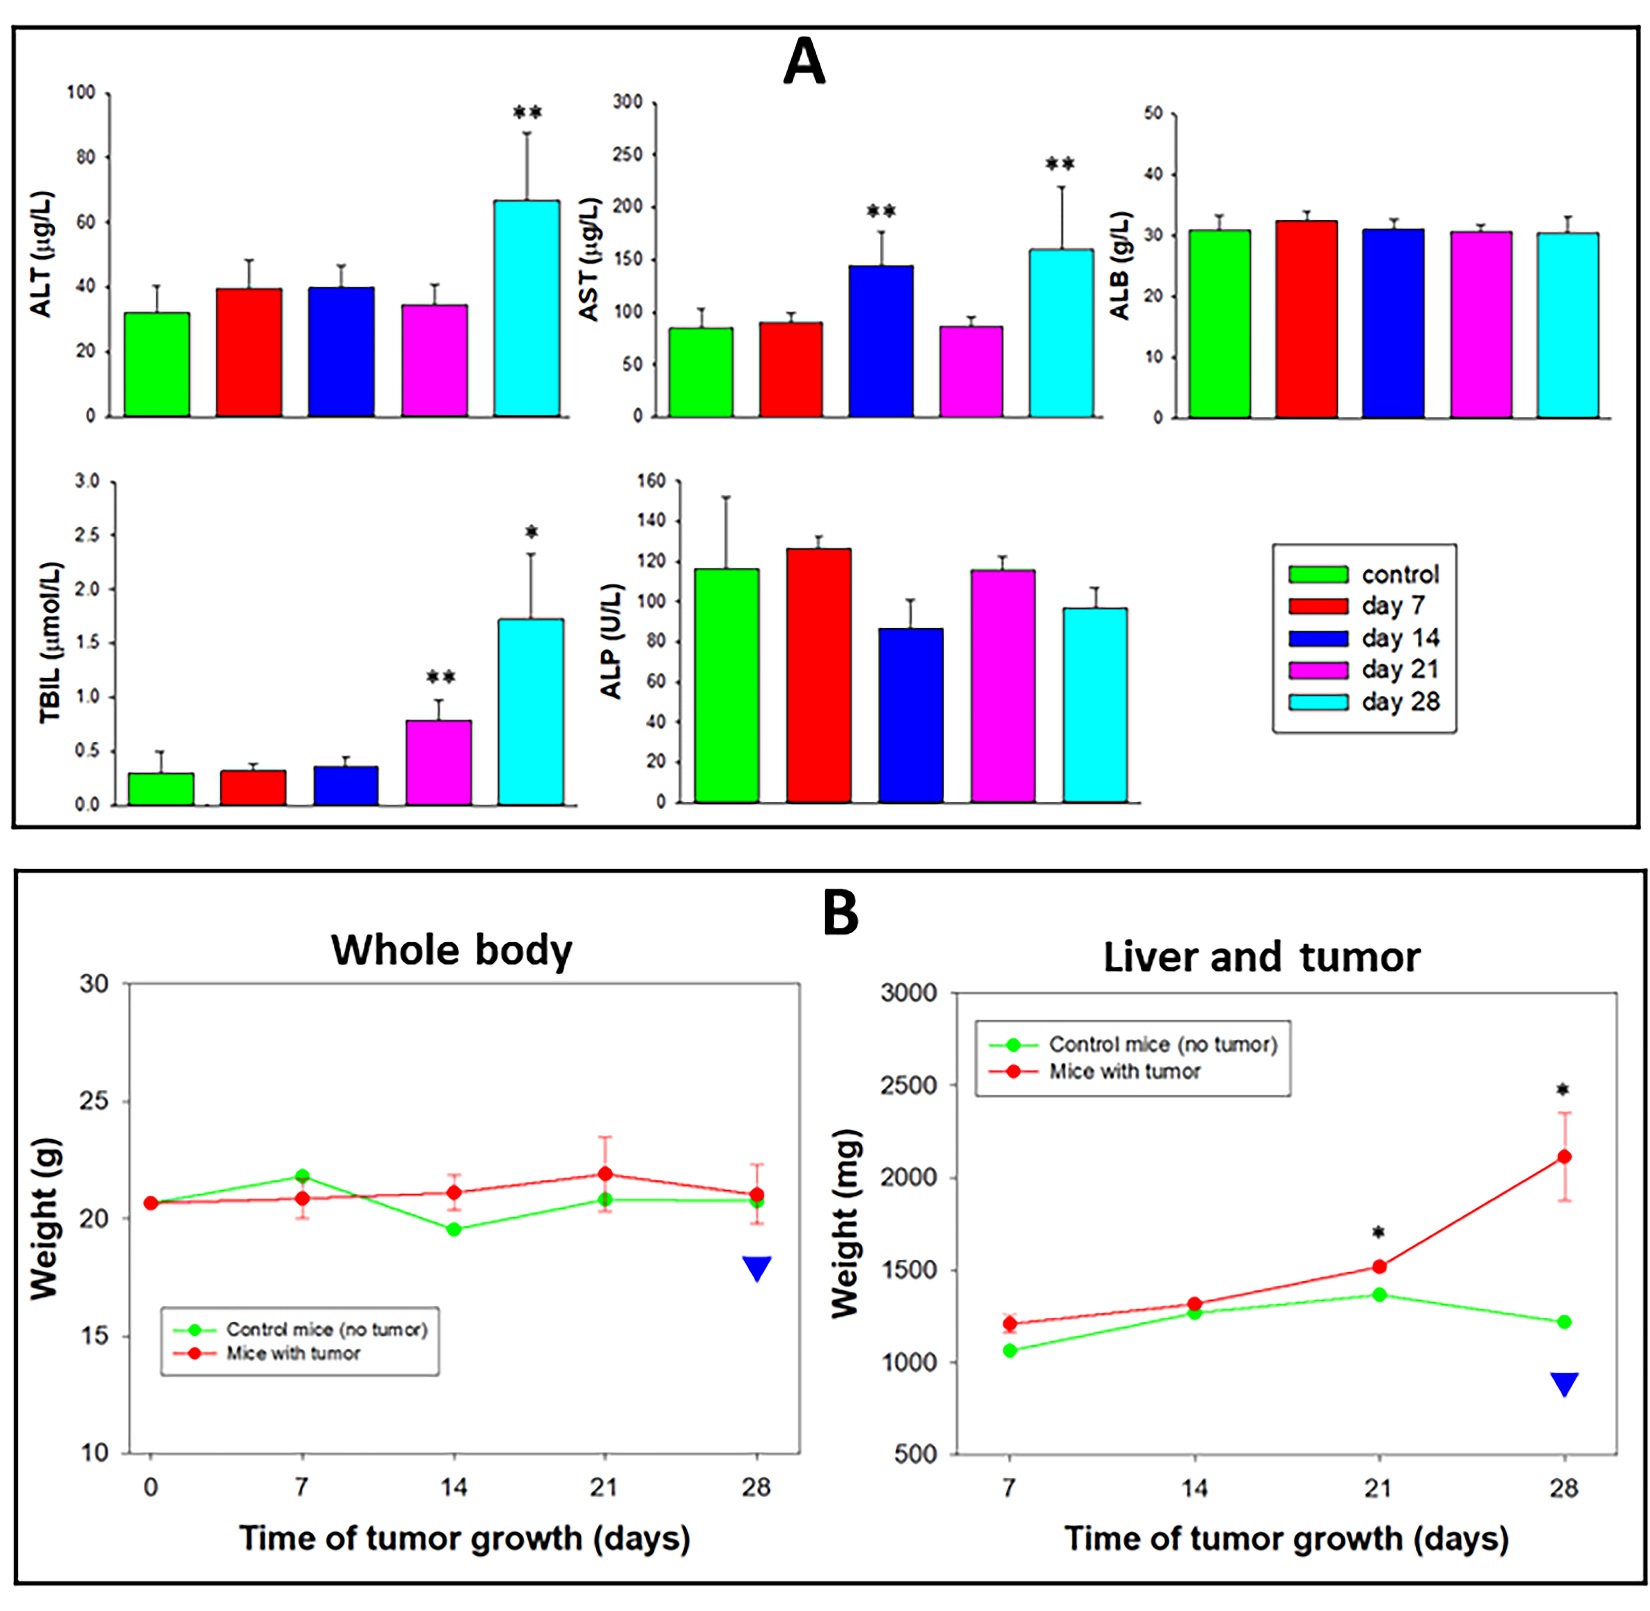
Figure 10E presents satellite tumors in three different extrahepatic organs (pancreas, kidney, and spleen) on day twenty-eight, suggesting the need for a broader survey of pathological outcome beyond the liver per se, because the identification of metastases in extrahepatic organs impacts on therapeutic choices and prognosis in humans. Figure 11 presents systemic adverse effects related to tumors. LFT, which remained normal on day twenty-one of the early-stage study (Figure 9) and remained mostly the same in the (more prolonged) 28-day subacute study (Figure 10). However, on day twenty-eight, a significant elevation of ALT, AST, and total bilirubin was documented (Figure 11A) indicating pathological consequences associated with tumor-bearing livers per se. Because FDP-DOX was not used in the study (Figure 10) differentiation of tumor-related adverse effects from possible adverse effects of FDP-DOX is cardinal in this orthotopic liver cancer model. Furthermore, the preserved body weight on day 28 (Figure 11B), was indeed misleading. Body weight is preserved due to a significant increase in liver weight (due to in situ tumor growth and extrahepatic satellite extensions) that obscured the 10% loss of body weight experienced on day 28 (illustrated by the blue arrowhead and the black line in Figure 11B, left). LFT at the end of week three was preserved, except for a mild increase in total bilirubin (TBIL). Thus, it is plausible to suggest that monitoring pharmacodynamic biomarkers of tumor-related biochemical biomarkers should be incorporated in acute (early stage) zone.
Figure 9: Characterization of early-stage Hep-3B-luc induced tumors progression in nude mice and liver function tests at days 7 and 14 days after inoculation. Measurement of tumor progression was performed on days 7 and 14 in separate groups of mice. (A) Changes in bioluminescence in tumor bearing mice measured by whole body, isolated livers monitored by IVIS. The error bars represent the SD of eight animals per group (n=8). (*) P<0.01 calculated using one-way ANOVA. (B) Bioluminescence images of the whole course over time. (C) Bioluminescence images and photographic view of isolated livers of control and tumor-bearing mice. Visible tumors attached to the liver are defined by yellow lines. (D) Liver function tests measured in control and tumor-bearing mice on days 7 or 14. The error bars represent the SD of four animas per control group (n=4) and eight animals for tumor-bearing animals (n=8).
Figure 10: Progression of Hep-3B-luc-induced tumors in nude mice up to 28 days. The study protocol has the same design as that described in the legend of Figure 9 with an extension of 2 weeks reaching the subacute stage. (A) Graphic presentation of whole-body bioluminescence (colored bars) and ex vivo images, respectively, of tumor-bearing livers (black bars). The error bars represent the SEM of five animals (n=4). (*) P<0.01, (**) P<0.05), (#) P=0.122 calculated using a one-way ANOVA. Whole-body images (B) and isolated livers + tumor (C) graphically presented in panel A. (D) Photographic display of isolated liver + tumor units. Yellow lines indicated areas of the liver affected by the tumor. (E) Bioluminescence images of non-liver organs from control and tumor-bearing mice isolated on day twenty-eight. Yellow arrows indicate metastatic points of tumor cells.
Figure 11: Progression of Hep-3B-luc-induced tumors in nude mice up to 28 days. The study protocol has the same design as that described in the legend of Figure 9 with an extension of 2 weeks reaching the subacute stage. (A) Graphic presentation of whole-body bioluminescence (colored bars) and ex vivo images, respectively, of tumor-bearing livers (black bars). The error bars represent the SEM of five animals (n=4). (*) P<0.01, (**) P<0.05), (#) P=0.122 calculated using a one-way ANOVA. Whole-body images (B) and isolated livers + tumor (C) graphically presented in panel A. (D) Photographic display of isolated liver + tumor units. Yellow lines indicated areas of the liver affected by the tumor. (E) Bioluminescence images of non-liver organs from control and tumor-bearing mice isolated on day twenty-eight. Yellow arrows indicate metastatic points of tumor cells.
Validation of FDP-DOX distribution to the left lobe of the liver using MRD regimen prior to Hep-3B-luc cancer cells inoculation.
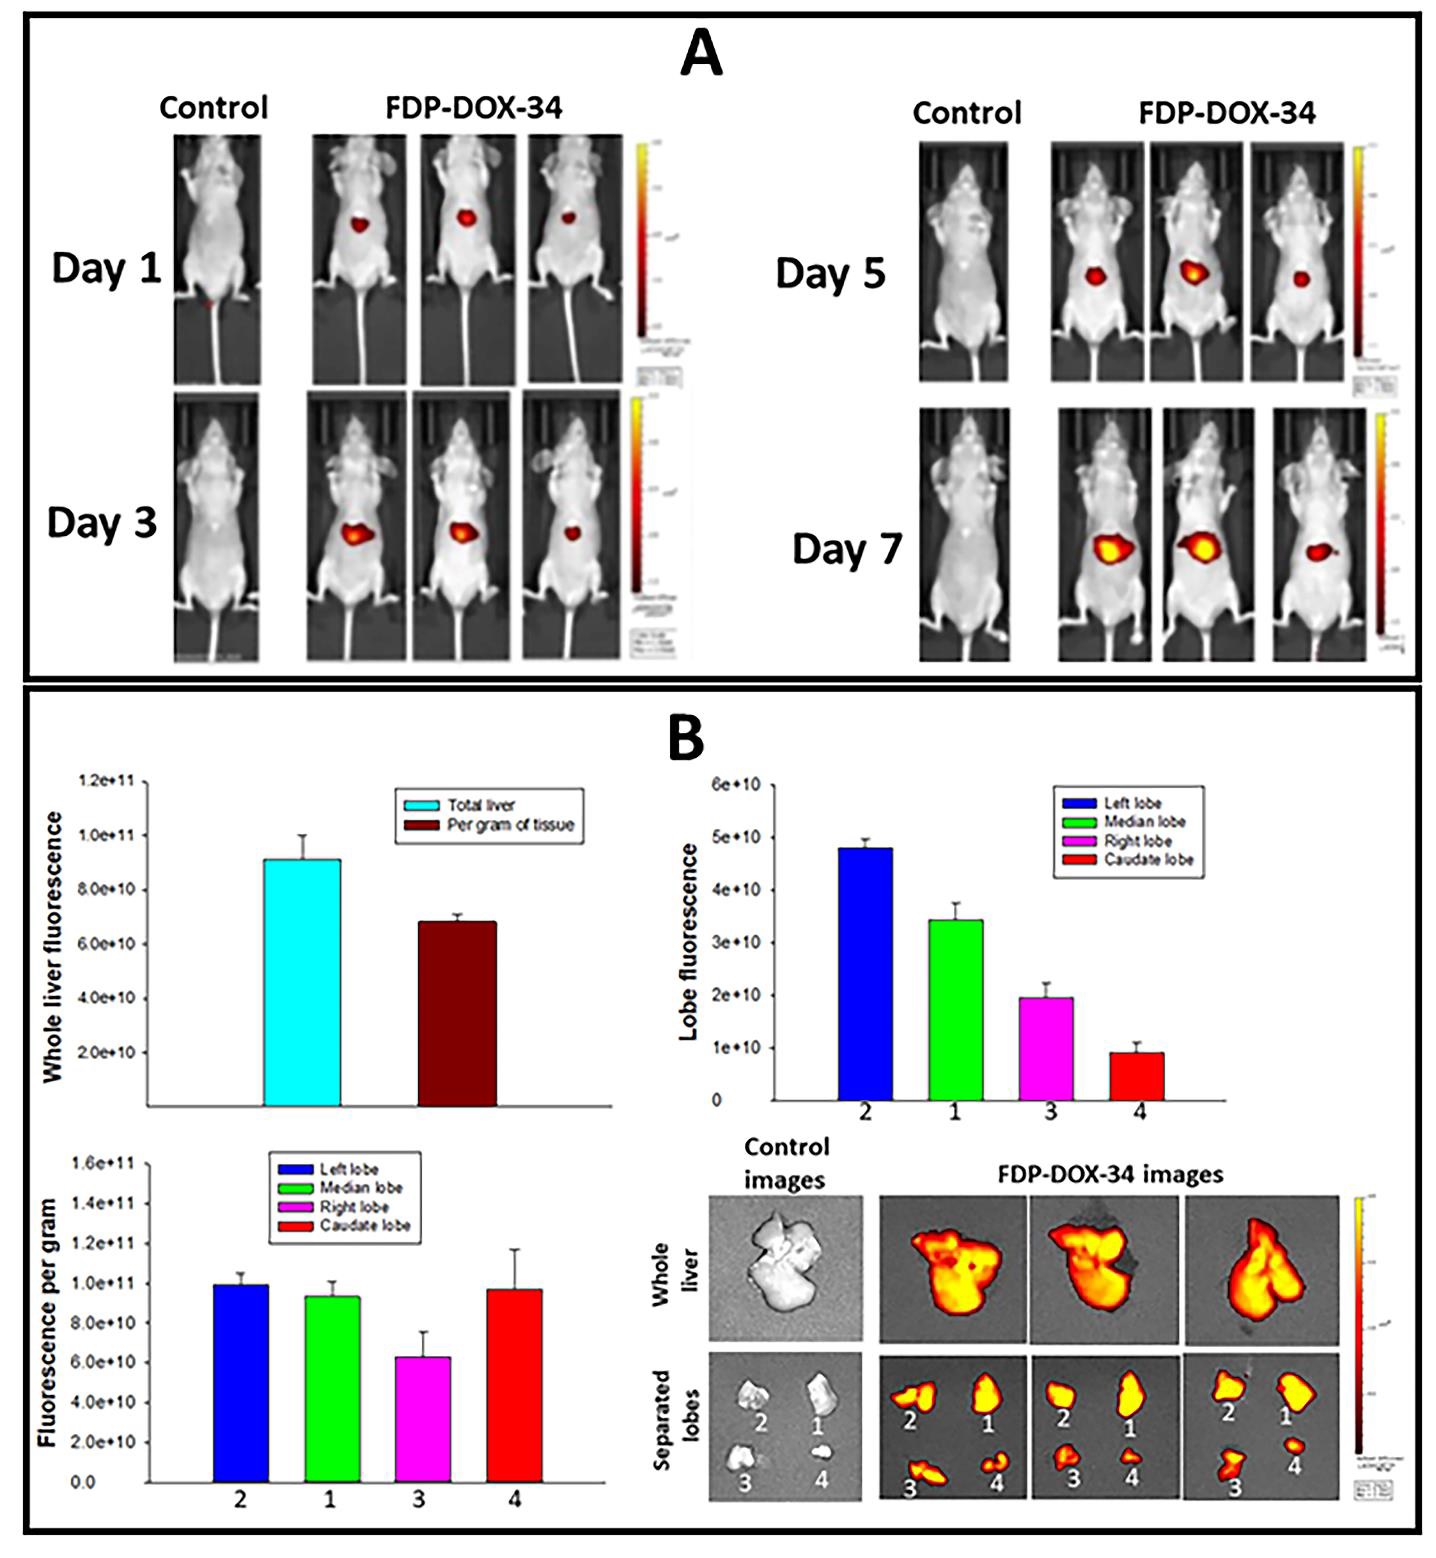
The orthotopic tumor model chosen for this study was generated by direct injection of cancer cells into the left liver lobe. Because the mouse liver has four lobes that differ in size, shape, and mass, we verified whether the left liver lobe captured at least as much FDP-DOX as the other lobes. To optimize particle deposition in the lobe of interest, we used an MRD dosing delivered by IV via repeated injection to comply with regulatory standards for volume (vehicle) administration to mice. Data on the distribution of FDP-DOX in the liver at large and in each of its lobes by using wholebody luminescence is shown in figure 12A, while the ex vivo fluorescence of the whole liver and each of its lobes is shown in figure 12B. Figure 13 presents fluorescence microscopy that localizes the particles within the targeted lobe by NIR; its ‘payload’- doxorubicin, by UV-vis and histochemistry for the phenotypes of the cells by H&E and DAPI.
The total body NIR fluorescence of each mouse (n=3) demonstrated dose-dependent, graded accumulation of particles in the liver (Figure 12A). Particles in the four lobes were detected, in which the left lobe presented the highest total fluorescence (upper panel, right) stratified by lobe mass, equal to the second and fourth lobes (Figure 12B). The overall image of the liver and its lobes is presented on the lower right of Figure 12B.
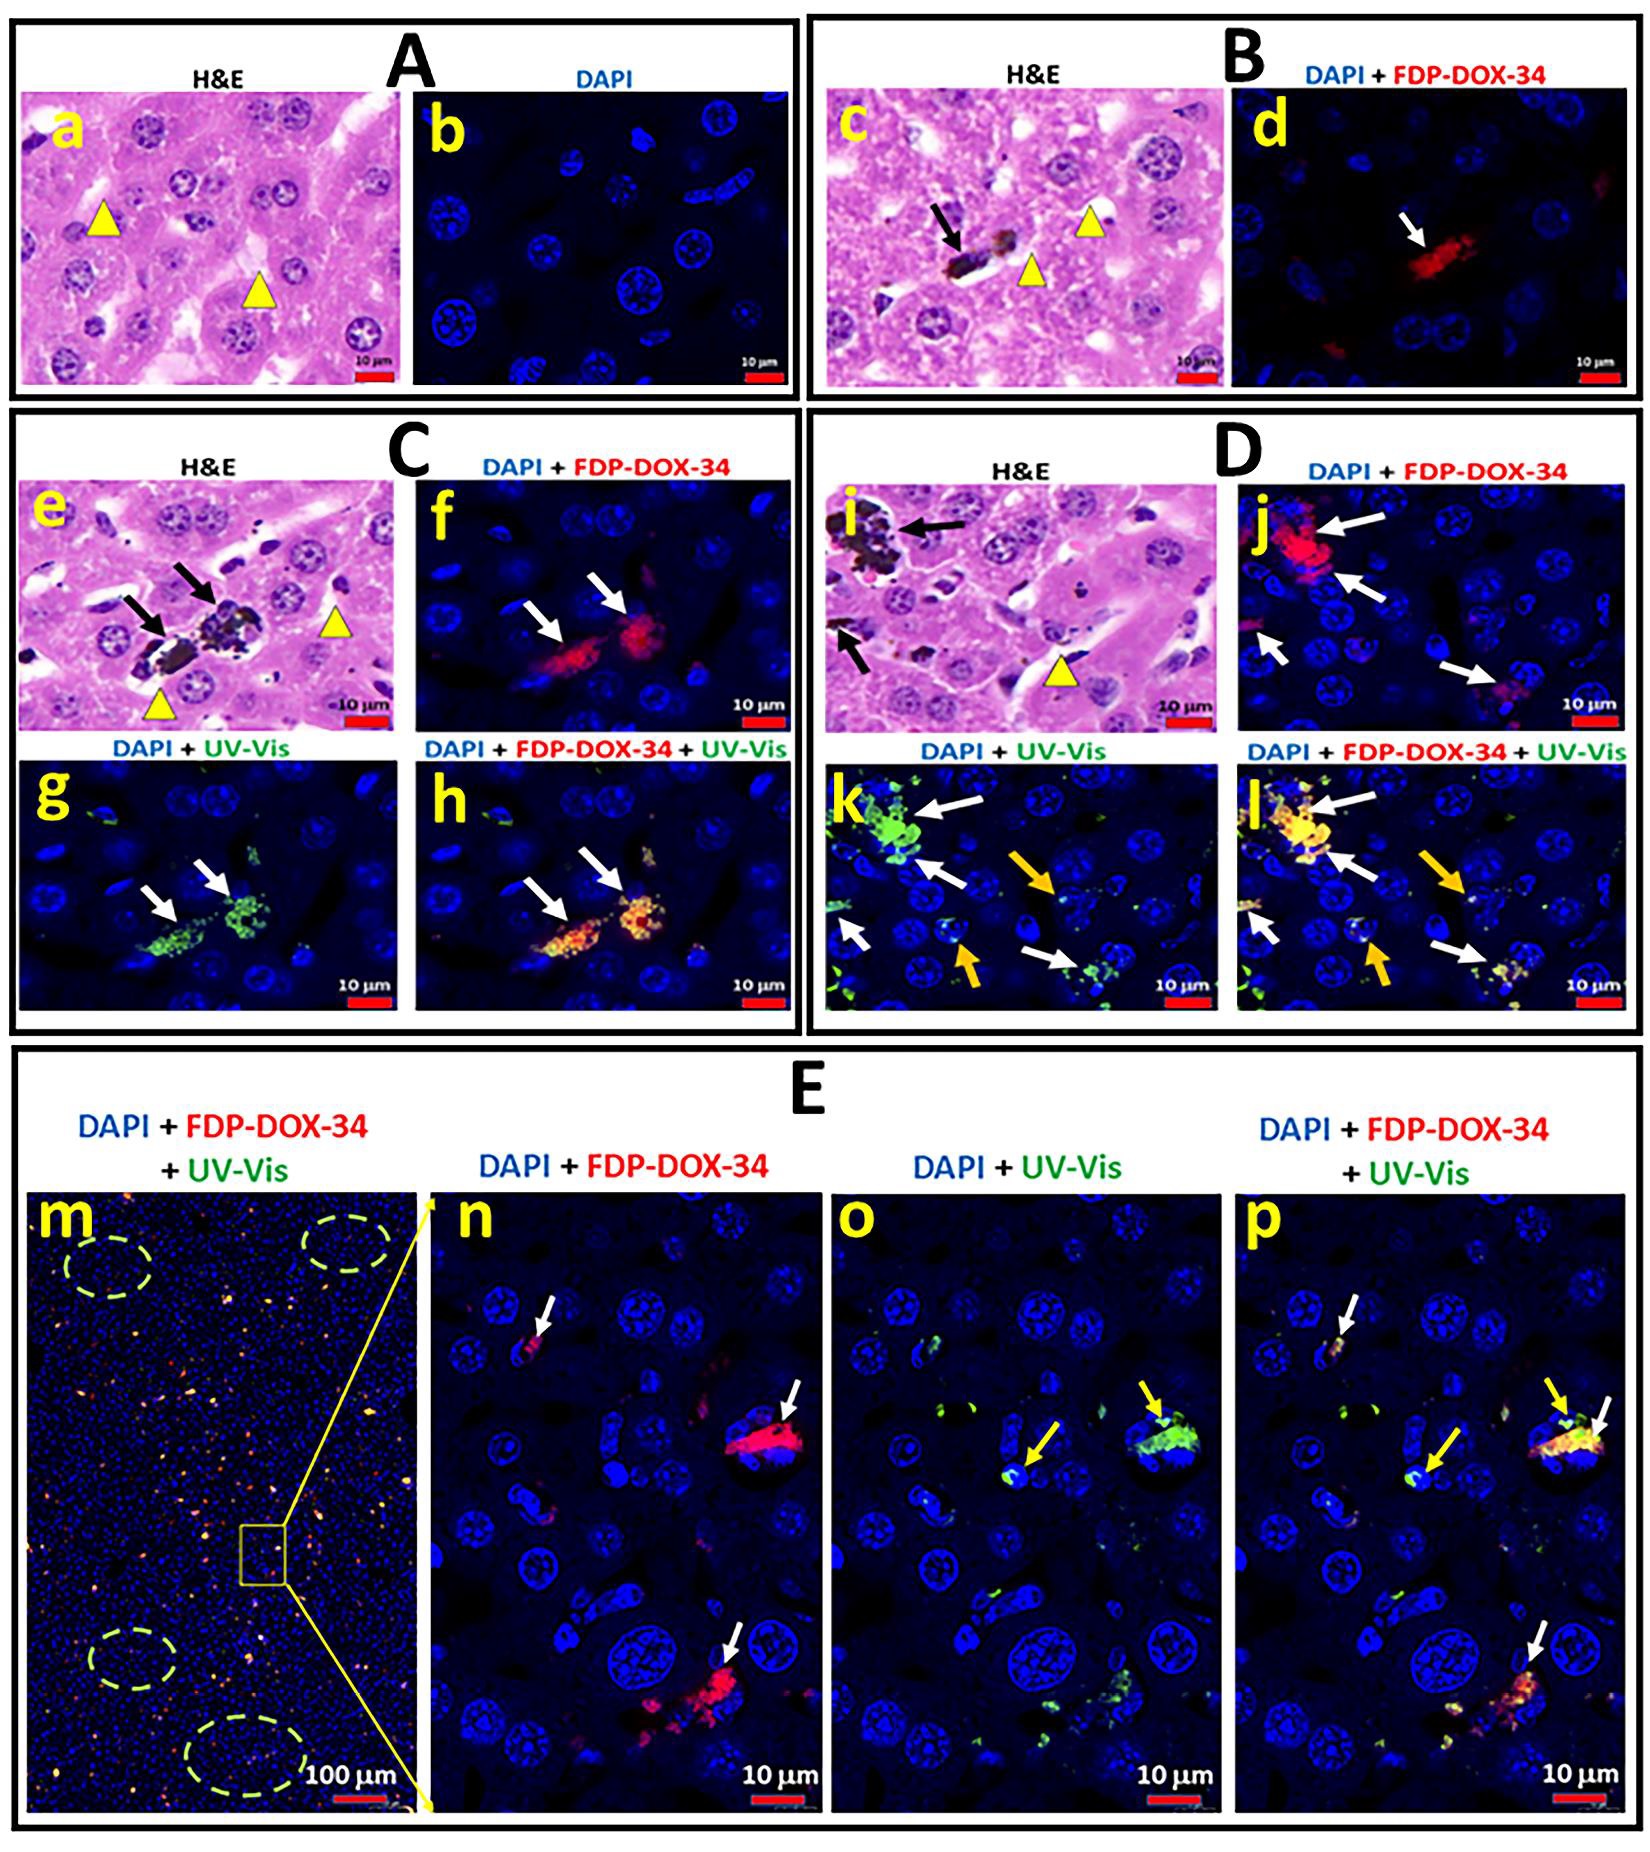
Figure 13 shows histological, histochemical, and fluorescence microscopy studies of the left liver lobe obtained from control mice (not inoculated by cancer cells) 14; days after onset of FDP-DOX-34 administration. Fig 13A presents H&E-stained slices of naïve nude mice liver cells; and the sinusoids system (yellow triangles). Figure 13B(c) shows H&E-stained slices obtained from treated mice where sinusoids suspected to contain particles were illuminated to emit NIR that validate the presence of FDP-DOX in the sinusoid (Figure 13B(d) and 13C(f). In section C (Figure 13C (g, h) UV-vis light demonstrates the presence doxorubicin colocalized with the particles (NIR red) as indicated by merged colors (yellow/orange). Yellow arrows in Figure 13D(k) suggest the presence of free DOX in the cells’ nuclei as distinct bright green localized to nuclei only. (Figure 13D(j) presents merged color meaning doxorubicin still associated with particles (white arrows) while Figure 13D(k) suggests free doxorubicin in nuclei marked by yellow arrows.
Figure 13E(m) presents low magnification of a panoramic view of the discrete and merged ‘identities’ of the particles per se and the merged NIR and UV-vis for DOX. Figure 13E (n, o, p) provides the discrete location of particles. (n) and DOX (o) and the merged images (p). It is important to note that sections n/o/p clearly favors DOX association with particles yet ‘singular green spots’ (p) suggest presence of free DOX associated with nuclei.
Interestingly, the ‘Landscape’ section (m) discloses the heterogeneity of particles distribution in the liver sinusoids where dense particles’ zones alternate with very sparse depositions zones. This heterogeneity may suggest that MRD assessed by acute escalation of IV dosing of FDPDOX are far from saturation, as suggested by whole-body bioluminescence, and that significant liver reserve may allow higher dosing regimens.
Taken together, the information provided in figures 12 and 13 strengthen the postulation that deposition of FDPDOX in the liver sinusoids desorbs at least some of its the ‘payload’ (DOX) which, by diffusion, could reach cellular elements including tumor cells within Hep-3B-luc tumor clusters.
Figure 12: Distribution of FDP-DOX-34 in the whole liver and in each of its lobes. Mice were injected with 3200 µg/mouse/week of FDP-DOX-34 distributed equally once in 48-hour intervals to accommodate volume restrictions. The nude mice were allowed to recover to day fourteen. Control animals received injections of equal volumes of PBS. All measurements were made on day fifteen. (A) Whole body bioluminescence was performed on days 1, 3, 5, and 7. (B) Weight and fluorescence of all liver and separated lobes of the liver from mice. Separated lobes were marked as follows: (1) left lobe, (2) median lobe, (3) right lobe, and (4) caudate lobe. The error bars indicate the SD of three animals per group (n=3).
Taken together, the information provided in figures 12 and 13 strengthen the postulation that deposition of FDPDOX in the liver sinusoids desorbs at least some of its the ‘payload’ (DOX) which, by diffusion, could reach cellular elements including tumor cells within Hep-3B-luc tumor clusters.
Figure 13: Distribution of FDP-DOX-34 in the whole liver and in each of its lobes. Mice were injected with 3200 µg/mouse/week of FDP-DOX-34 distributed equally once in 48-hour intervals to accommodate volume restrictions. The nude mice were allowed to recover to day fourteen. Control animals received injections of equal volumes of PBS. All measurements were made on day fifteen. (A) Whole body bioluminescence was performed on days 1, 3, 5, and 7. (B) Weight and fluorescence of all liver and separated lobes of the liver from mice. Separated lobes were marked as follows: (1) left lobe, (2) median lobe, (3) right lobe, and (4) caudate lobe. The error bars indicate the SD of three animals per group (n=3).
Pharmacodynamic consequences of FDP-DOX-75 on progression of orthotopic Hep-3B-luc tumors in the livers of BALB/c mice
The data generated by the pilot studies provided significant assurance about the key properties of FDP-DOX in respect to: 1) High preferential deposition (94.6 %) in the liver, including access to the left liver lobe where Hep-3Bluc tumor cells are inoculated; 2) preferential distribution of FDP-DOX in liver (sinusoids) but very limited amount within Hep-3B tumors clusters; 3) MRD dosing regimens did not disrupt LFT or CBC nor were thriving deficiencies noted in earlier stages of tumors’ evolution. While most pilot studies were conducted in small groups of mice (n=3–5) and lower doses of DOX, taken together, the pilot studies generated strong justification for launching the pharmacodynamic study.
Pharmacodynamic effects of FDP-DOX-75 on Hep3B-luc-induced orthotopic liver tumors in BALB/c mice in an early-stage model
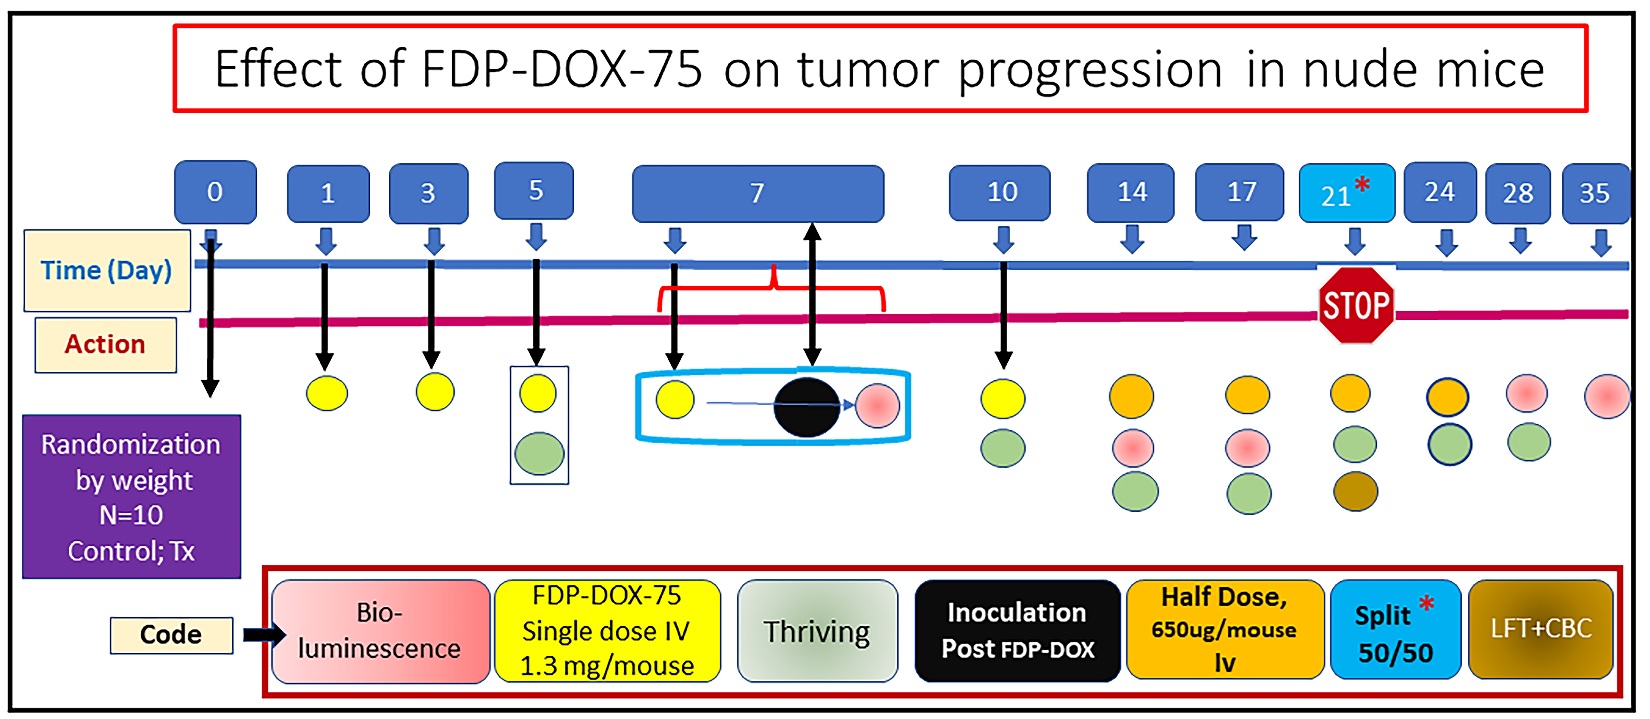
Figure 14 provides the design and sequence of actions used pharmacodynamic study, which aimed at evaluating the impact of pre-treatment FDP-DOX-75 on Hep-3Bluc-induced liver tumor inoculated 7 days post FDPDOX deposition in the same liver lobe. FDP-DOX-75 was administered in four consecutive IV treatments at 24-h intervals, supplemented by a fifth dose of 1.3 mg/mouse on the day of inoculation. In addition, a half dose of FDP-DOX was repeated as maintenance on days 14 and 17, 21 and 24 days. The end point of the study was arbitrarily predetermined for 21 days, to meet the earlier stage tumors, but an option to prolong the study after splitting the groups on day 21 (50%/50%) so that safety biomarkers (LFT, CBC) could be monitored. An extension period was arbitrarily set to day 35.
Pharmacodynamic consequences of Hep-3B-luc inoculation in the liver pretreated with FDP-DOX-75
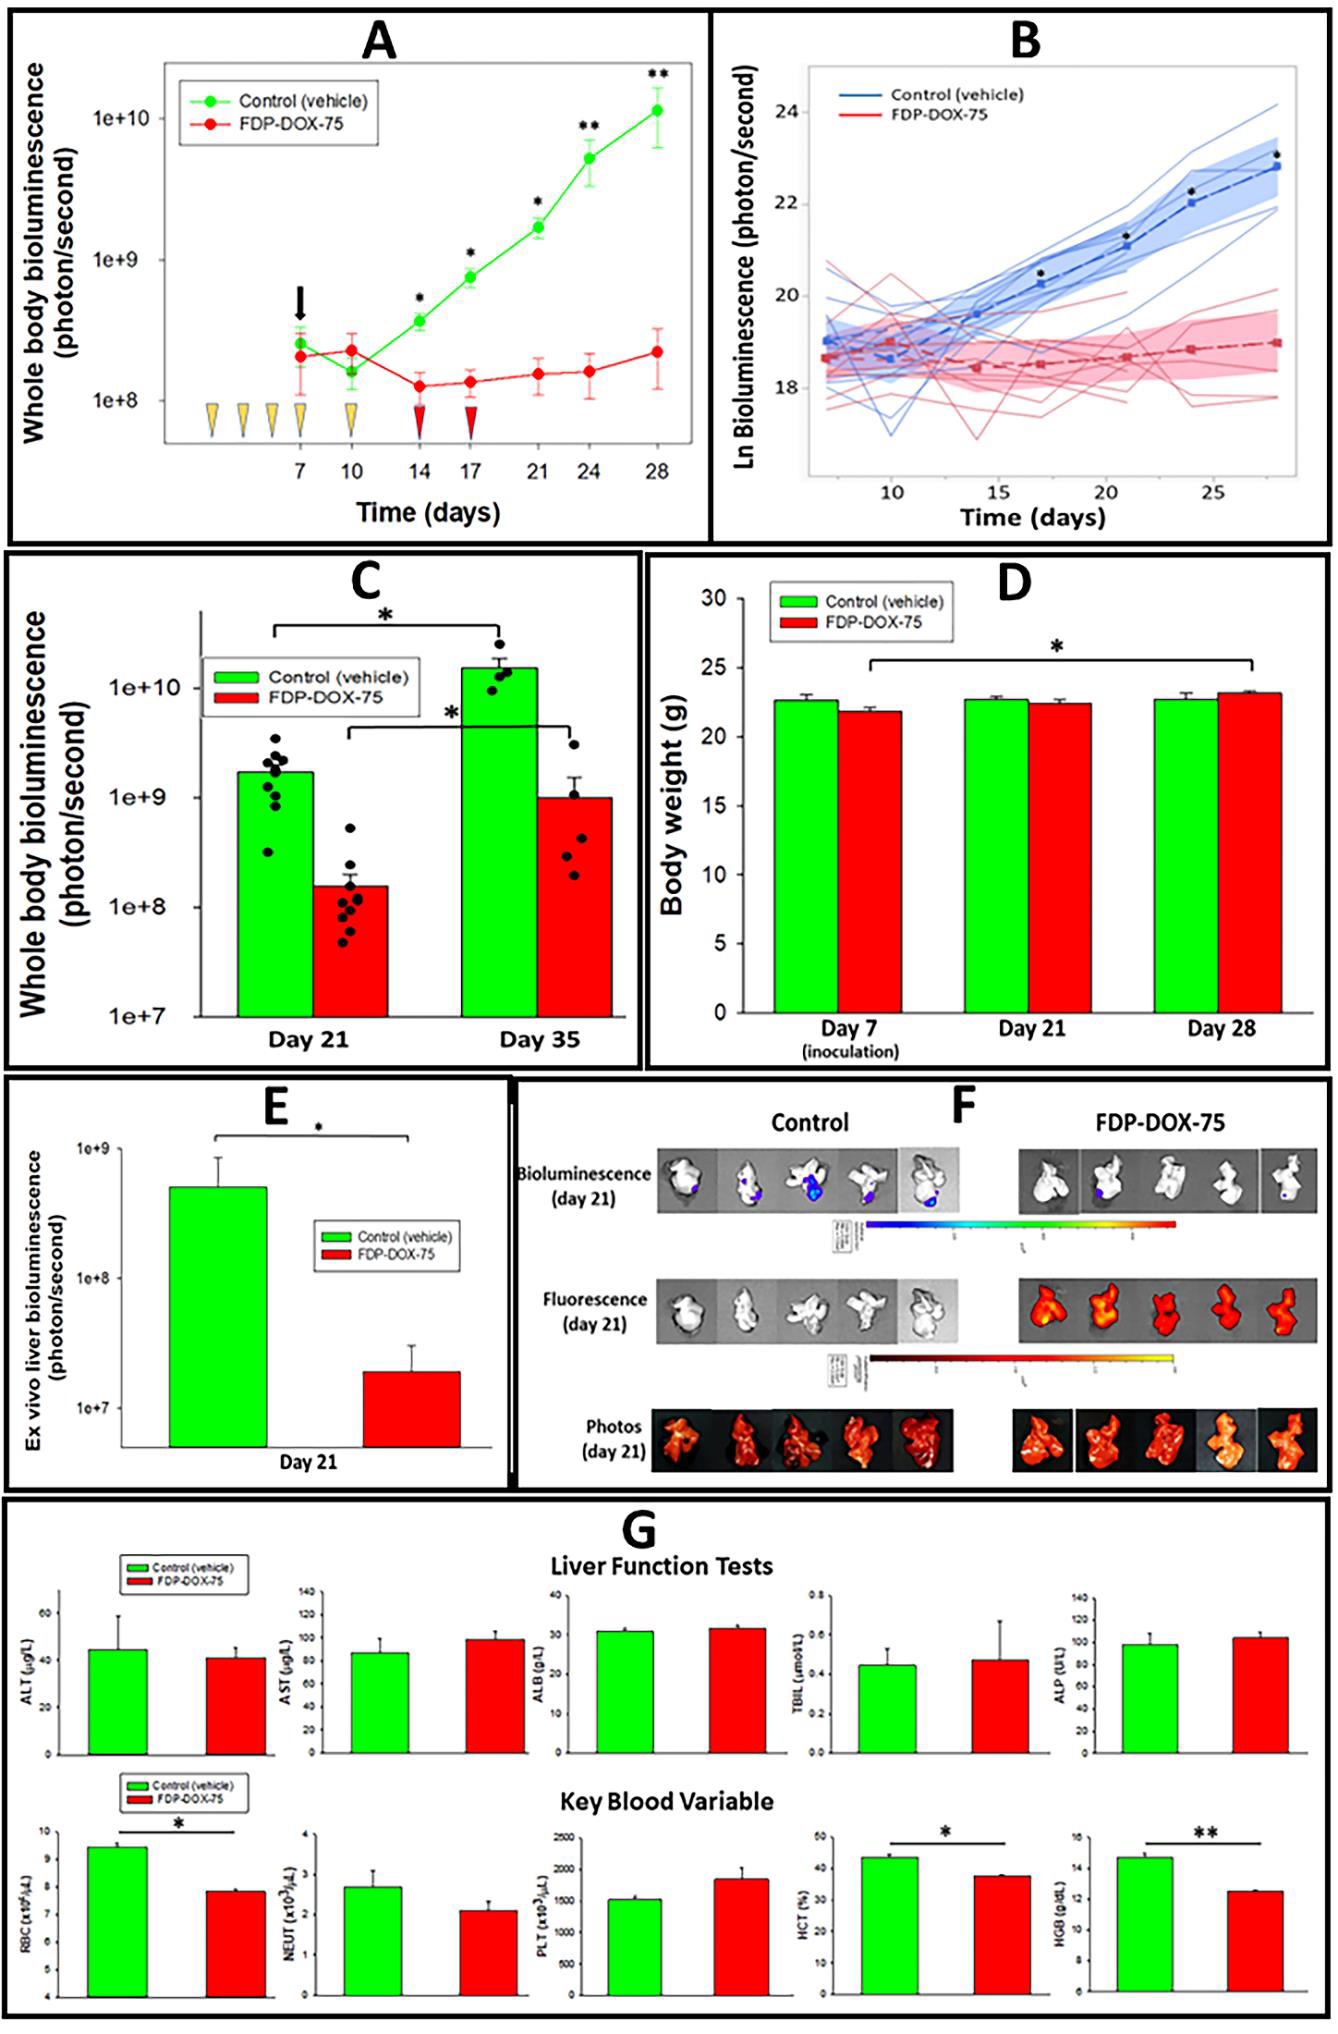
Figure 15A presents an exponential progression of tumors in the vehicle control group as monitored by wholebody bioluminescence. The FDP-DOX-75 treated mice failed to demonstrate tumor development up to the 28th day. On the twenty-one-day whole body bioluminescence in the control group was 10.97 folds over the FDP-DOX-75 treated group and by day twenty-eight 51.45 folds over the treated group. Figure 15B provides an individual temporal progression of tumors by whole-body bioluminescence of each mouse using multivariate and covariate ANOVA with repeated measures design up to day twenty-eight. Statistical significance was established by SPSS as detailed in the methods of data processing. Figure 15C presents trend for tumor development in the FDP-DOX-75 treated mice by day thirty-five. The emerging tumor growth in the treated group on day thirty-five could be a consequence of an escape from the pharmacological effects of DOX due to tolerance or lack of sufficient drug levels. The detailed causality remains to be studied.
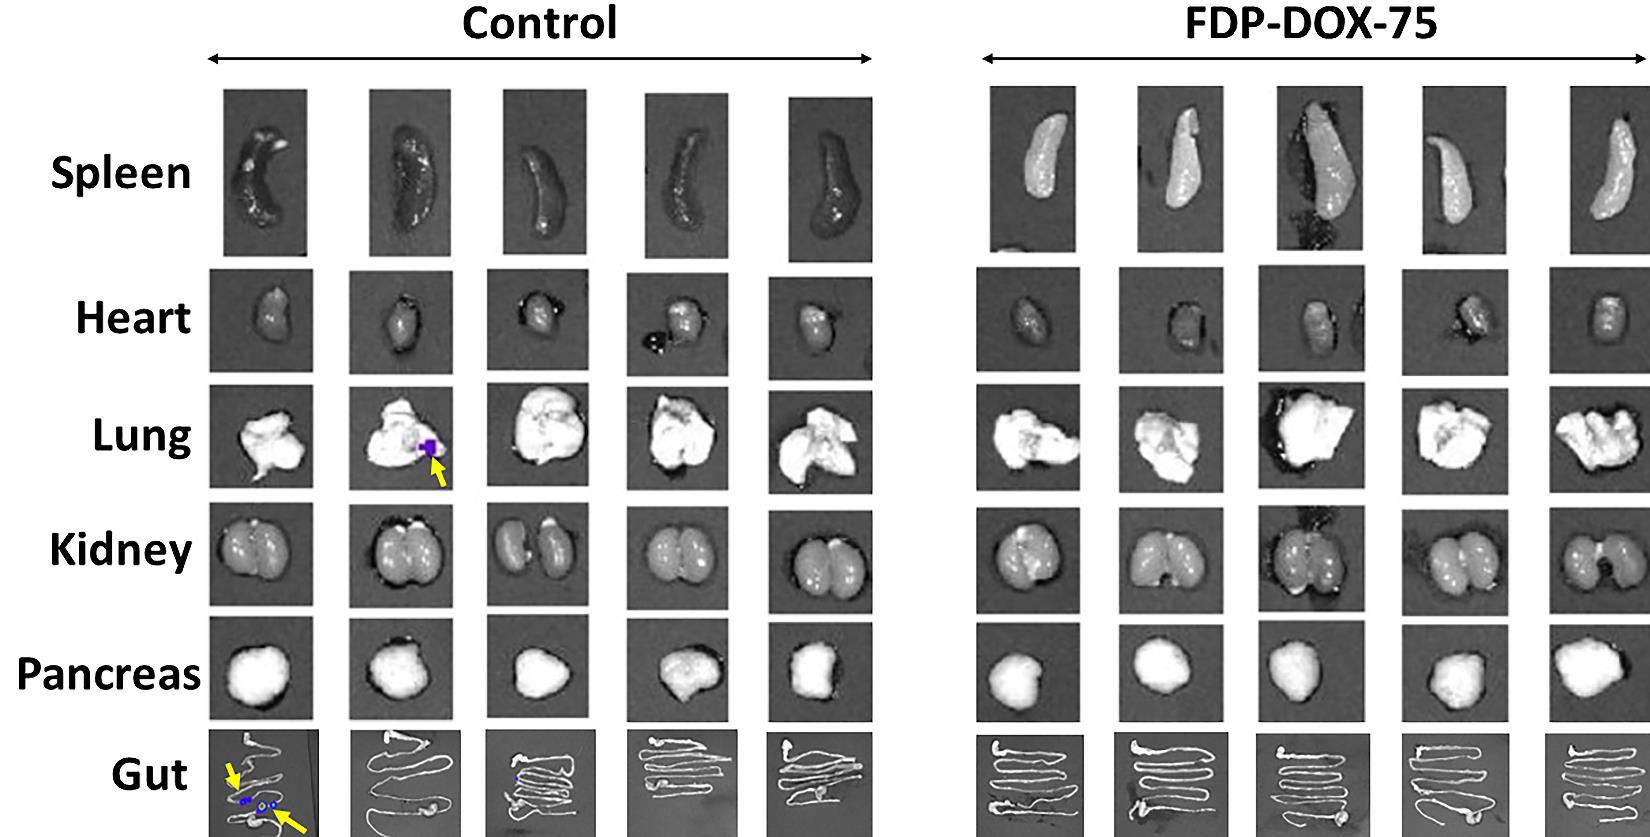
Figure 15D suggest thriving of both experimental groups as evident by same body weight throughout the first 4 weeks. Figure 15E validates the significant differences between the control and the treated group based on ex vivo fluorescence imaging. However, several CBC variables suggest minimal (but significant) elevation of RBC (red blood cells), hematocrit, and hemoglobin in the control group. Figure 16 presents several extrahepatic organs collected on day 21 where the control group presents evidence for metastases in one lung and 2 lesions in the ileum of another mouse. None were registered in the treated group.
Figure 14: Design of the first pharmacodynamic study designed to evaluate the efficacy of FDP-DOX-75 in blocking tumor progression. Color-coded of various actions assigned by day are presented in the box panel. Day 21 was designed a priori for the duration of the study, in which 50% of the mice were anesthetized for the LFT and CBC tests. All procedures listed along the timeline are detailed in the Methods section.
Figure 15: Effect of FDP-DOX-75 on Hep-3B-luc tumor growth in nude mice. Female BALB/c nude mice were inoculated with Hep-3B-luc cells on day 7 after completion of 5 consecutive IV injections of FDP-DOX-75 (1.3 mg/mouse) on day 1 and repeated on days 3, 5, 7 and 10. Maintenance doses (0.65 mg/mouse) was supplemented on days 14, 17, 21, and 24. (A) Whole-body bioluminescence measured on the indicated days (see Figure 14) using IVIS. The black arrow indicates the day of Hep-3B-luc cell inoculation. Yellow wedges indicate days of treatment with full doses of FDP-DOX-75 (1300 µg/mouse). The red wedges indicate treatment days with maintenance doses of 0.65 mg/mouse of FDP-DOX-75. The error bars represent SEM mice (N = 10) per group up to day 21, and five mice per group (days 24, 28, and 35). (*) P<0.001 and (**) P<0.01 calculated by one-way ANOVA for comparison of FDP-DOX-75 and vehicle control groups. (B) Bioluminescence assessment of tumor growth by ANOVA. The lines indicate logarithmic bioluminescence for each animal as an assessment of tumor growth. The dotted lines represent the mean luminescence for each treatment and, the shaded area, the 95% confidence interval of the mean as determined by multivariate ANOVA after accounting for the variation of the sample. (*) indicates a significant Tukey HSD at α=0.01. (C) Whole-body bioluminescence of mice comparing continued growth from days 21 to 35. The error bars indicate the SEM of 10 animals per group (day 21), and five animals per group (day 35) (*) P<0.01 calculated by one-way ANOVA. (D) Body weights of control and treated mice on days 7, 21, and 28. The error bars indicate the SEM for ten animals per group (days 7 and 21) and five mice for day twenty-eight. No statistical differences were identified between the three time points. (E) Presents ex vivo bioluminescence of five isolated livers from each of the groups (vehicle controls and FDP-DOX-75) illustrating (upper images of panel F) large disparity in tumor growth in the control group. The error bars represent the SEM (N = 5). (*) P = 0.016 calculated by one-way ANOVA. (F) Ex vivo imaging by IVIS of the liver in five controls and five treated mice on day twenty-one to verify the whole-body bioluminescence data. The upper panel indicates the consistency of tumor sizes in control and was visibly much smaller in the treated animals. The middle panel illustrates ex vivo liver images for NIR in the control and FDP-DOX-75 treated mice showing particle deposition in all FDP-DOX-75 treated mice and none in the vehicle control (middle panel). The lower panel provides photographic illustration of the tumor in all inoculated mice. (G) Liver function and blood parameters analyzed in blood collected on day twenty-eight after inoculation. The error bars represent the SEM of 4–5 animals per group. (*) P<0.001 and (**) P<0.01 calculated by one-way ANOVA.
Figure 16: Effect of FDP-DOX-75 on Hep-3B-luc tumor metastases to extrahepatic organs. Female BALB/c nude mice were inoculated with Hep-3B-luc cells on day seven. Full-dose treatment with FDP-DOX-75 (1.3 mg/mouse) was started on day one and repeated on days 3, 5 and 7. Maintenance doses (half dose at 0.65 mg/mouse) was supplemented on days 14 and 17. Organs were isolated for bioluminescence (IVIS) analysis on day twenty-one. Yellow arrows indicate metastasized tumor from the liver.
Validation of FDP-DOX-75 efficacy by direct inspection of tumor cell density
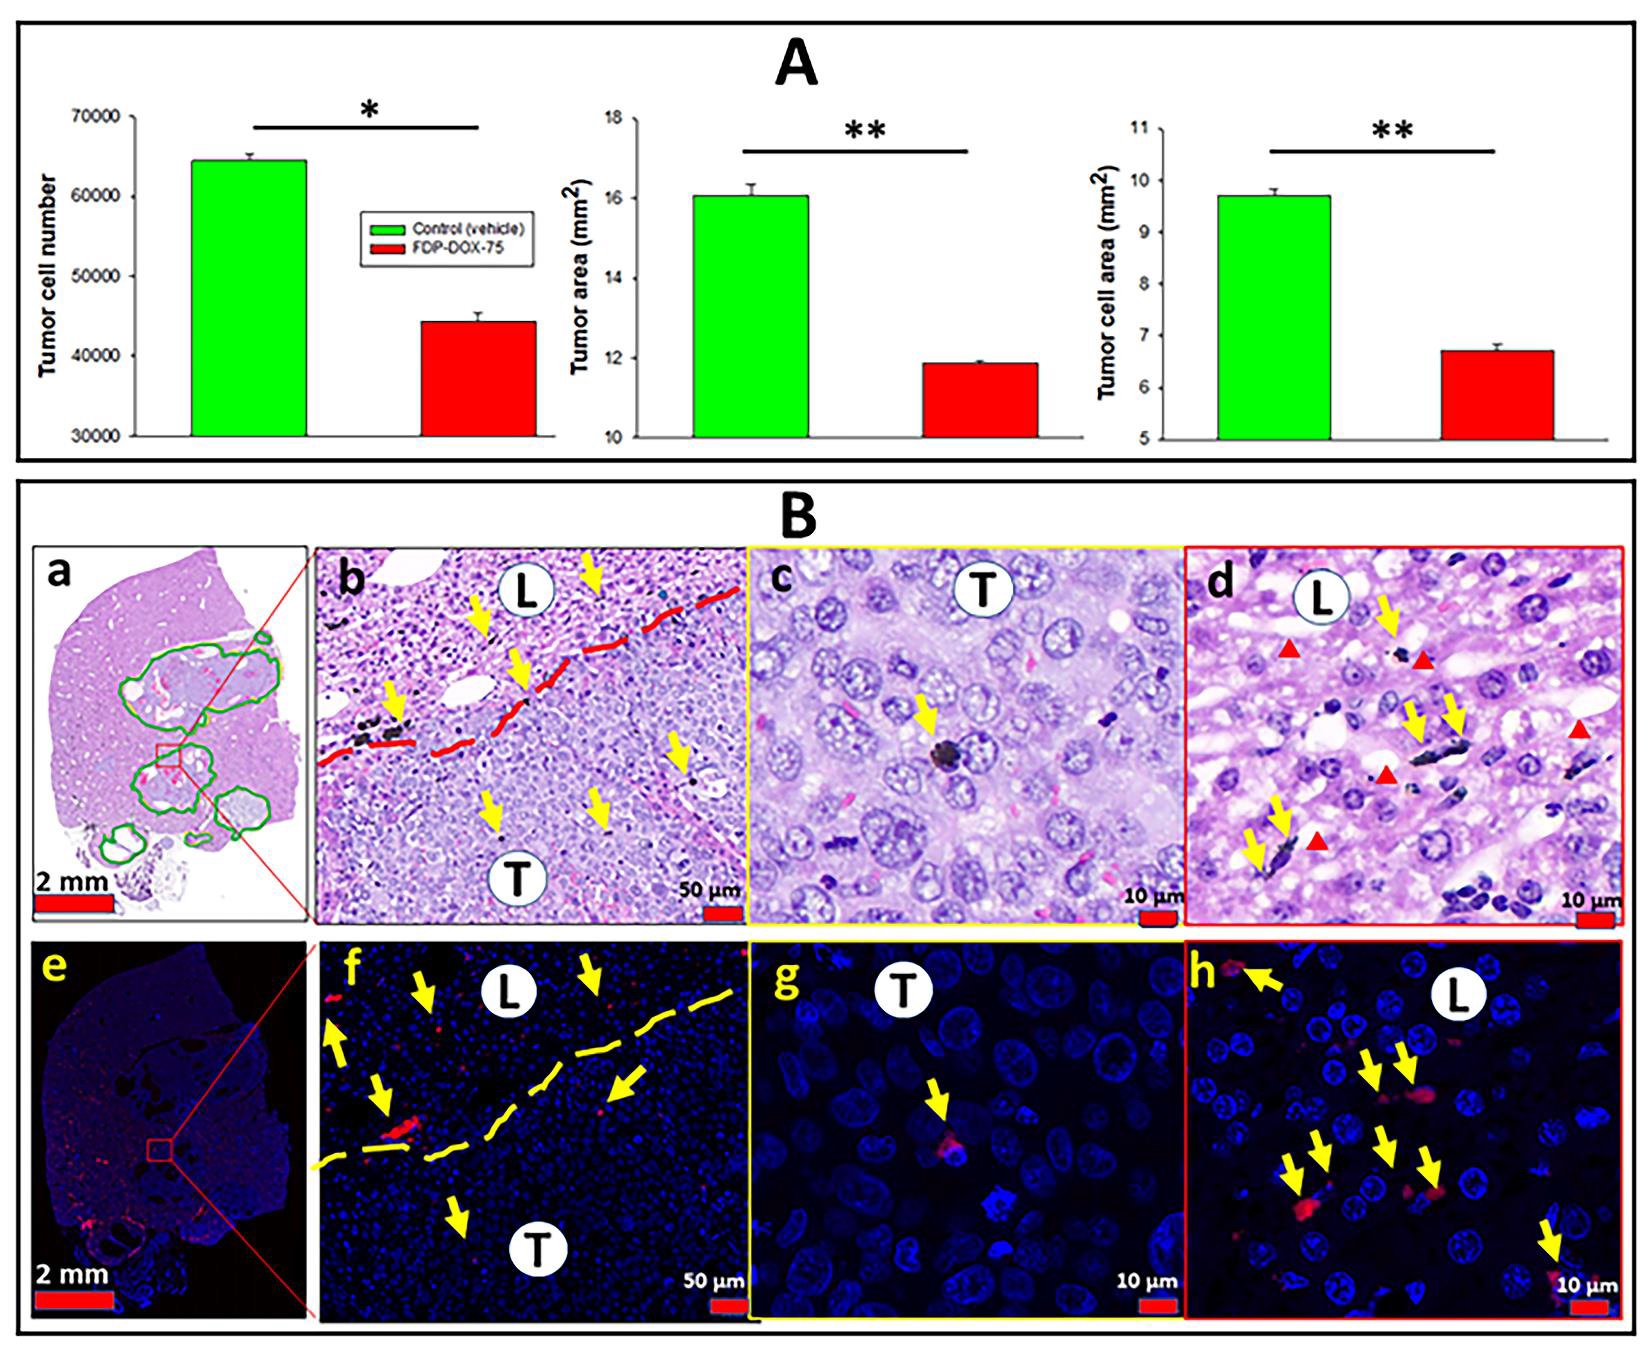
Figure 17A provides quantitative histochemical analysis of three variables of tumors collected on day twenty-one and processed as described in the method section (vide supra). All three variables indicate a modest decrease in the quantity of tumor cells number in the treated group as compared with the control group, backed by statistical significance. Figure 17B(a) provides a low magnification scan of the liver landscape where several tumors are delineated by a dashed line that demarcates the tumors within the liver. The five-fold magnification in figure 17B (c, d) affirms a paucity of particles in tumor tissue and an abundant deposition of FDP-DOX in the liver sinusoids based on the fluorescent microscopy representative of DAPI stained slices of figure17B (f,g,h). The profile of particles’ distribution in the tumor zone versus that in the liver of this early stage (3 weeks) model figure 17B (f-h), was consistent with the observation made in late-stage tumors (9 weeks) where FDP-DOX-35 was infused at the end stage, as depicted in Figure 8.
Exploration of immune-inflammatory cells in FDPDOX parcellation in liver and tumor tissues in the earlier orthotopic tumor development
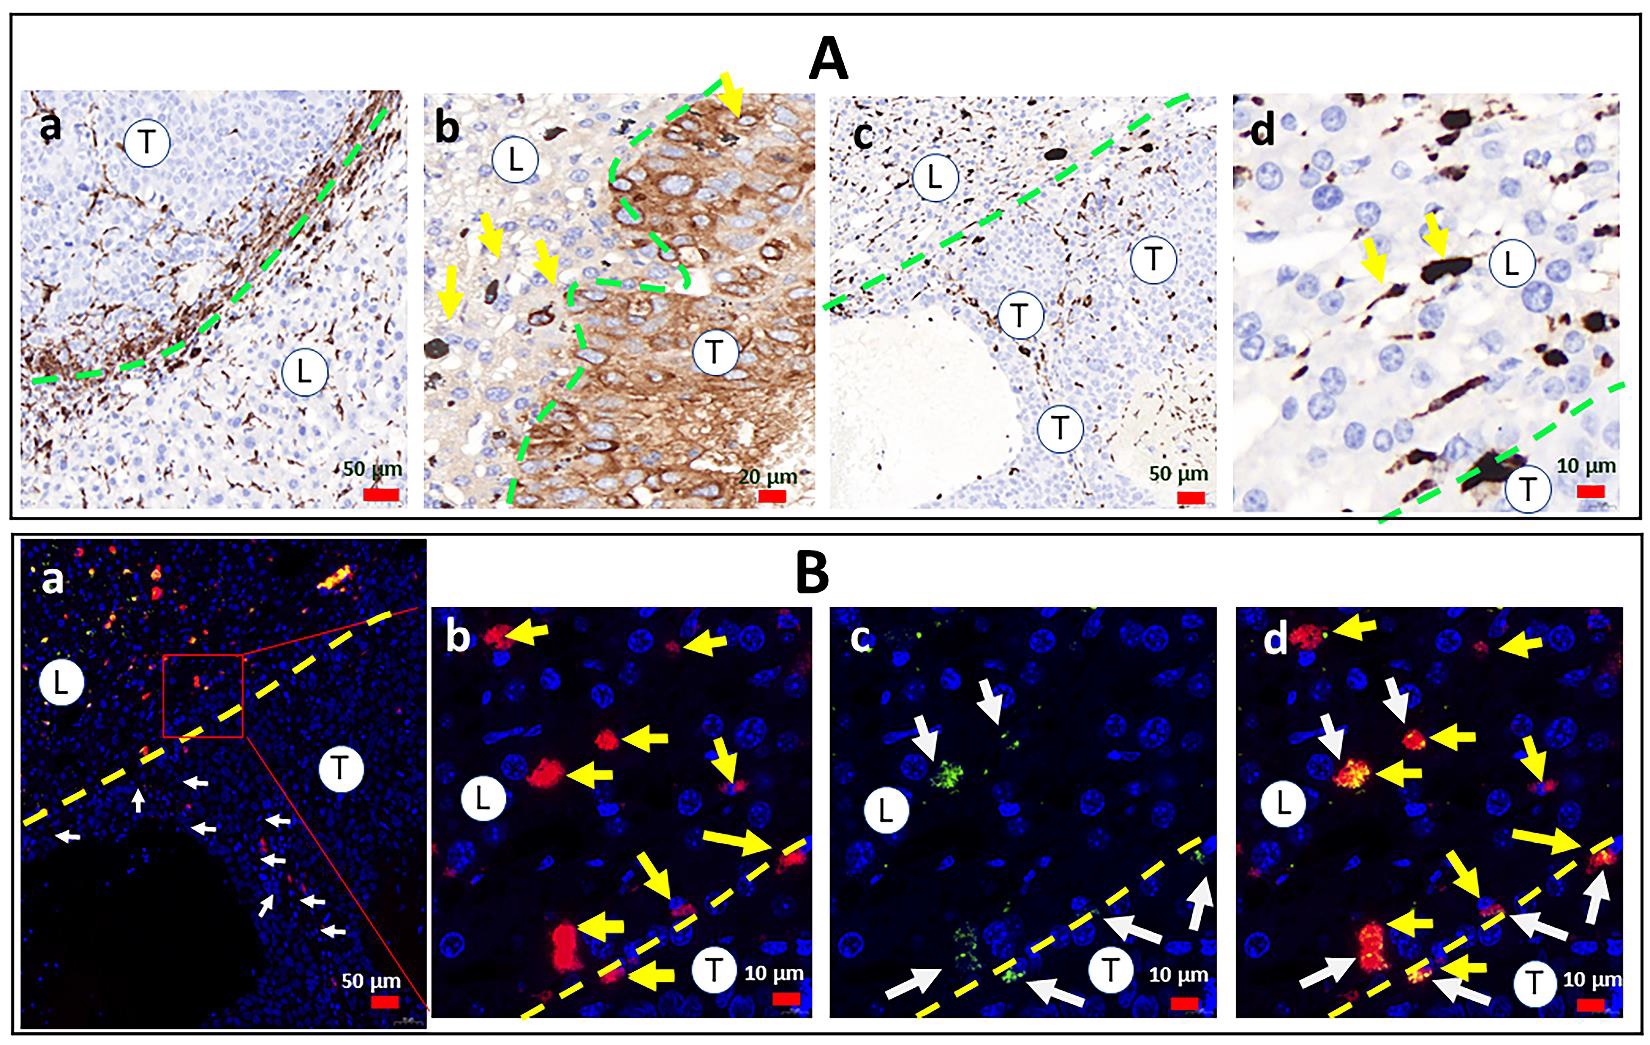
The paucity of FDP-DOX particles in the tumor as compared to liver raised the possibility that liver and tumor macrophages, (not visible by standard histology methods) have scavenged FDP-DOX and diminished its visibility in the extra-cellular milieu. To explore this possibility, the need to differentiate phagocytic cells from parenchymal cells of either liver or tumor was achieved by differential staining of the macrophages by immuno-histochemistry using CD68 (a well-known monocytic cells lineage antigen) while tumor cells (Hep-3B-luc) were immuno-stained by AFP (as describe in the method section vide supra). Figure 18A(a) illustrates intense phagocytic response in the liver and tumor Interface where CD68+ positive network of ‘spiky’ cells-morphology in both the tumor and liver sides of the interface (Figure 18A (a, c). Particles were situated in liver sinusoids (Figure 18A, (d)) are verified by NIR co-localization (Figure 18B (d)), but no NIR could be co-localized with CD68 positive cells. The distribution of particles in figures 18B re-capitulates the preference of particles deposition in the liver (Figure 18B (b, c, d).
Figure 17: Histological, histochemical, and fluorescence microscopy quantitative monitoring tumor cells in control mice treated with FDP-DOX-75 and distribution of particles in the liver and tumor tissues. Female BALB/c nude mice were inoculated with Hep-3B-luc cells on day 7 after completion of 54 consecutive IV injections of FDP-DOX-75 (1.3 mg/mouse) day 1 and repeated on days 3, 5, 7, and 10. Maintenance dosing (0.65 mg/mouse) was supplemented on days 14 and 17. Mice were sacrificed on day 21, livers were dissected and fixed with PFA. Paraffin sections were prepared and stained with H&E using standard methodology. (A) Graphs present tumor expansion measured by counting a tumor cell number, tumor area, and tumor cell area. Error bars indicate SEM from five animals (n=5). (*) P<0.001 and (**) P<0.01 calculated using one-way ANOVA. (B) Images at different magnifications of paraffin sections stained with H& E (a–d) and DAPI (e–h), which were used to quantify tumor progression presented in panel A. The green solid line (a), red dashed (b), and yellow dashed (f) lines present a border between normal liver tissues (L) and tumor tissue (T). Red triangles indicate sinusoids in the normal liver. Yellow arrows indicate the accumulation of particles.
Figure 18: Distribution of immune-inflammatory elements and particles in the early phase (3 weeks) of Hep-3B-luc tumor progression in nude mice. Female BALB/c nude mice were inoculated with Hep-3B-luc cells on day seven after completion of consecutive IV injections of FDP-DOX-75 (1.3 mg/mouse) on day one and repeated on days 3, 5, and 7 (see scheme Figure 14). Maintenance dose (0.65 mg/mouse) was supplemented on days 14,17, 21, and 24. Half of the mice were euthanized on day 21 for biomarkers of safety (LFT, CBC) and the rest of the mice (N-=5) terminated on day 35. Paraffin blocks were generated with livers extracted ex vivo and sectioned at 5-µm-thickness for histological workout. (A) Colorimetric images of immune-stained livers from vehicle-treated mice with anti-CD-68 (a); and FDP-DOX-75-treated mice - with and anti-AFP (b). Slices prepared from FDP-DOX-75 treated animals stained with H&E obtained at five-fold magnification (c, d). Green dashed lines mark the border between tumor tissue (T) and liver tissue (L). (B) Fluorescence microscope images of liver sections obtained from tumor-bearing mice treated with FDP-DOX-75 that illustrate the disparity of particle distribution across a dashed yellow line that marks the borders of live/tumor interfaces. (a) Low magnification images with marked by white arrows particles in tumor (T) area, liver area is labelled as (L); (b–d) high magnification images with particles (NIR) deposition shown by yellow arrows in the liver area (L) and in tumor (T) area (b), DOX (UV-vis green) deposition in the nuclei (DAPI) marked by white arrows (c), merged colors (d).
Discussion
The primary objective of this study was to evaluate the potential of FDP-NV-700/800nm~DOX (FDP-DOX-75) to mitigate the progression of an orthotopic Hep-3-luc tumor in BALB/c mice model. The aim of the study was driven by the high mortality rate of liver cancer and limited availability of therapeutic options especially in late stages of the disease, whether of primary or secondary to metastases originating from other malignancies such as CRC [53,54].
Our interest in targeted delivery of chemotherapeutics by FDP carriers carrier emanated from recent observations on highly preferential deposition of FDP-NV-700/800 nm in the livers of rodents, in line with a similar observation made by other investigators in other animal models [27,19,45,49]. The preferential accumulation of FDP-NV in the liver might be associated with functionalized negative surface of FDP-NV and by the innate biological activity of the reticuloendothelial system of the liver and its specialized Kupffer (macrophages) cells. These factors ensure rapid clearance of FDP-NV from the systemic circulation (T1/2 of ~ 4.5 min in rats) with an overall clearance of 85% within 90 minutes after IV infusion [21]. These pharmacokinetic properties limit the acquisition of blood/plasma ingredients that form a corona around the particles that could modify the physical/chemical properties of the particles, surface, prolong their circulation time, and augment the risk of adverse reactions such as cardiotoxicity. Therefore, it is not surprising that the targeted delivery of chemotherapeutics by various carriers have already been attempted, such as the use of anthracycline drugs carried by complex liposomes, polymers, or micelles [35]. However, some of these carriers such as DoxilTM are used with the intention of prolonging the circulation time of the carrier payload in contrast to the transient pharmacokinetics of FDP-NV, aimed at fast deposition in the pathological target and sustained desorption of therapeutic agents [30]. Furthermore, the antigenic properties of liposomes and the instability of micelle and polymers are in marked contrast to the durability and agnostic biology of FDP-NV [22-23]. Prolonged residency of FDP-DOX in the liver and slow local disposition of the carried chemotherapeutic agent are paramount to minimize adverse, ‘off target’ effects and optimize the therapeutic index.
The experiments described herein adhered to the goals of translational medicine by exercising critical ‘Go-No-Go’ decision points for risk reduction through validation of all key premises. Five pilot studies were designed to confirm the assumptions made along the experimental path (Figure 2) which provided evidence supporting the feasibility and successful pharmacodynamic outcomes (Figure 15). Of particular importance was the delivery of FDP-DOX in the site of interest (malignant tumor cells deposition) where DOX is desorbed and diffused into the cancer cells, leading to their elimination. Therefore, by design, FDP-DOX had an a priori advantage, a condition that differs from the clinical situation where treatment is conditioned on the presence of tumors as defined by standardized imaging methods, pathology and biochemical biomarkers methods [54,55]. Therefore, the design of the pharmacodynamic study mainly aimed to prove that in the presence desorpted DOX from FDP-DOX-75 at the location to which cancer cells are inoculated, the replication of cancer cells and tumor formations are retarded and that the dosing regimen applied preserve liver functions and key hematological biomarkers.
The emergence of tumors growth at the end of week seventh week (Figure 15C) could well be the consequence of insufficient free DOX which likely was degraded and cessation of treatment. Rapid metabolism of DOX by liver and cancer cells are is a well-known primary route of clearance of anti-neoplastic agents. Therefore, more prolonged treatment with an increased “payload” (higher dose per mg particles) might extend the pharmacological impact. Other mechanisms that might have contributed to the emergence of tumors in late stages could be attributed to emergence of tolerance/resistance to chemotherapeutic agents, a phenomenon known in HCC.
A more obvious, plausible, and pertinent condition for tumor resurgence in FDP-DOX treated mice could be found in data presented in Figures 13E(m), 17B(e), and 18B(d). In three independent experiments a panoramic display of particle distribution after IV infusion revealed substantial heterogeneity of FDP-DOX distribution. This high heterogeneity was observed in mice exposed only to FDP-DOX (Figure 13E(m) and those who were exposed to similar dosing regimens while harboring Hep-3B-luc liver tumors (Figure 17B and Figure 18(e). In Figure 13E(m), the panoramic view of particles’ distribution illustrates areas of dense FDP-DOX deposition and zones with sparse FDP-DOX depots (circled by yellow dashed lines). These observations suggest that the liver retention capacity exceed significantly over the acute MRD, and that increasing the FDP-DOX dosing mass might enhance drugs delivery and improved therapeutic outcome.
Data presented in Figure 18A (a, c) illustrate robust immune-inflammatory reaction typified by CD68-positive cells at the interface of the liver and cancer borders. Figure 18B(a) illustrates a significant increase in FDP-DOX deposition in tumor zones marked by white arrows.
The mechanism(s) by which FDP-DOX-75 arrested Hep3B-luc tumors’ development observed in our orthotopic HCC model is complex. The paucity of FDP-DOX in the tumor clusters shown in the late stage (9 week) and in the earlier stages (2-3 weeks), suggests an indirect mode of action. Because FDP-DOX was deposited in the liver sinusoids, an anatomical element specific to the liver (no such anatomical element exists in tumor tissue), the ‘arrest and hold’ of tumor growth (Figure 15) is likely due to DOX diffusion from DOX desorbed in the sinusoids which afforded DOX diffusion into the tumor clusters. Figure 13E(o) provides data generated in FDP-DOX treated mice suggesting the presence of DOX in the nuclei of liver cells. We postulate the same process could well take place in cancer cells. This observation raises the concern that healthy liver cells could well become a ‘collateral damage’ of FDP-DOX treatment, although no interference with LFT was observed in the early and medium terms of the orthotopic model (up to 4 weeks). Therefore, FDP-DOX carriers might be an optimal adjunct to trans catheter ablative methods. In reference to the possibility that FDP-NV per-se harm normal liver cells, our in vivo, ex vivo and in vitro studies as well as results from other researchers reported high biocompatibility compared to lipid, micelles, polymers, and inorganic carriers [17,21- 23,26,33,36,48].
Taken together, the pharmacodynamic study presented in this manuscript has clearly demonstrated that FDP-DOX-75 administered intra-venously impaired the development of the orthotopic tumor while preserving normal LFT and CBC Our study also suggests that direct to tumor injection of FDP-DOX might be a superior to systemic injection of FDPDOX for both efficacy and safety benefits.
Conclusion
The present studies investigated whether FDP-NV700/800nm can serve as a carrier for chemotherapeutics (e.g., doxorubicin) for liver cancer metastases. This study is an unprecedented attempt to explore properties of submicrometer fluorescent nanodiamonds in this model. This study also validates the properties of FDP-NV-700/800nm, including its distribution patterns and the utility of NIR imaging in experimental oncology. Follow up studies are necessary to optimize treatments regimens, safety, and tolerability over long term periods. These experiments, in summation encourage continuation of the program toward clinical utility using direct to tumor injection. Finally, the prospect of direct to tumor injection of FDP-DOX or other ligands, suggest that this technology could spare the embolic component of the TAE (Trans Arterial Embolism) of TAE/ TACE procedure and reduce risks of severe adverse events associated with the embolic procedure.
Disclosure
The authors report no conflict of interest in conducting this work.
Funding
Private (Debina Diagnostic Inc.).
Competing interest
None.
Tischfield DJ, Gurevich AG, Johnson O, Gatmaytan I, Nadolski GJ, et al. (2022) Trans arterial Embolization Modulates the Immune Response within target and Nontarget Hepatocellular Carcinomas in a Rat Model. Radiology 303: 215–225. [ Ref ]
McGlynn KA, Petrick JL, El-Serag HB (2021) Epidemiology of hepatocellular Carcinoma. Hepatology 73: 4-13. [ Ref ]
Massarweh NM, El-Serag HB (2017) Epidemiology of Hepatocellular Carcinoma and Intrahepatic, Cholangiocarcinoma. Cancer Control 24: 1–11. [ Ref ]
Yang JD, Hainaut P, Gores GJ, Amadou A, Plymoth A, et al. (2019) A global view of hepatocellular carcinoma: trends, risk, prevention and management. Nat Rev Gastroenterol Hepatol 16: 589–604. [ Ref ]
Taniai M (2020) Alcohol and hepatocarcinogenesis. Clin Mol Hepatol 26: 736–741. [ Ref ]
Ascha MS, Hanouneh IA, Lopez R, Tamimi TA, Feldstein AF, et al. (2010) The incidence and risk factors and risk factors of hepatocellular carcinoma in patients with nonalcoholic steatohepatitis. Hepatology 51: 1972–1978. [ Ref ]
Ben Ari Z, Weitzman E, Safran M (2015) Oncogenic viruses and hepatocellular carcinoma. Clin Liver Dis 19: 341–60. [ Ref ]
Marengo A, Rosso C, Bugianesi E (2016) Liver Cancer: Connections with Obesity, Fatty Liver, and Cirrhosis. Annu Rev Med 67: 103–117. [ Ref ]
Charlton M, Levitsky J, Aqel B, OʼGrady J, Hemibach J, et al. (2018) International Liver Transplantation Society Consensus Statement on Immunosuppression in Liver Transplant Recipients. Transplantation 102: 727–743. [ Ref ]
Mazzaferro V, Llovet JM, Miceli R, Bhoori S, Schiavo M, et al. (2009) Predicting survival after liver transplantation in patients with hepatocellular carcinoma beyond the criteria: a retrospective, exploratory analysis. Study. Lancet Oncol 10: 35–43. [ Ref ]
Orcutt ST, Anaya DA (2018) Liver Resection and Surgical Strategies for Management of Primary Liver Cancer. Cancer Control 25: 1073274817744621. [ Ref ]
Wang K, Wang R, Liu S, Peng G, Yu H, et al. (2020) Comparison of the safety and efficacy of hepatic resection and radiofrequency ablation in the treatment of single small hepatocellular carcinoma: systematic review and and meta-analysis. Transl Cancer Res 11: 580–590. [ Ref ]
Habibollahi , Sheth RA, Erik N K Cressman EN-K (2022) Histological Correlation for Radiofrequency and Microwave Ablation in the Local Control of Hepatocellular Carcinoma (HCC) before Liver Transplantation: A Comprehensive Review. Cancers (Basel) 13: 104. [ Ref ]
Yang L, Shan J, Shan L, Saxena A, Bester L, et al. (2015) Transarterial embolization therapies for unresectable intrahepatic cholangiocarcinoma: a systematic review. J Gastrointestinal Oncol 6: 570–588. [ Ref ]
Miller FH, Vendrami LC, Gabr A, Horowitz JM, Kelahan LC, et al. (2021) Evolution of Radio-embolization in Treatment of Hepatocellular Carcinoma: A Pictorial Review. Radiographic 41: 1802–1818. [ Ref ]
Kallini JR, Gabr A, Salem R, Lewandowski RJ (2016) Trans arterial Radioembolization with Yttrium-90 for the Treatment of Hepatocellular Carcinoma. Adv Ther 33: 699–714. [ Ref ]
Lv TR, Hu HJ, Liu F, Regmi P, Jin YW, et al. (2022) The effect of trans arterial chemoembolization in the management of intrahepatic cholangiocarcinoma. A systematic review and meta-analysis. Eur J Surg Oncol 48: 956–966. [ Ref ]
Kishore SA, Bajwa R, Madoff DC (2020) Embolo-therapeutic Strategies for Hepatocellular Carcinoma: 2020 Update. Cancers (Basel) 12: 791. [ Ref ]
Chang Y, Jeong S-W, Jang J-Y, Jae Kim Y (2020) Recent Updates of Trans arterial Chemoembolization in Hepatocellular Carcinoma. Int J Mol Sci 21: 8165. [ Ref ]
Xie ZB, Ma L, Wang XB, Bai T, Ye JZ, et al. (2014) Trans-arterial embolization with or without chemotherapy for advanced hepatocellular carcinoma: a systematic review. Tumour Biol 35: 8451–8459. [ Ref ]
Culp WTN, Johnson EG, Giuffrida MA, Rebhun RB, Cawthra JK, et al. (2022) Evaluation of the use of a novel bioabsorbable polymer drugeluting microsphere for trans arterial embolization of hepatocellular neoplasia in dogs. PLoS One 17: e0269941. [ Ref ]
Schicho A, Pereira PL, Haimerl M, Niessen C, Michalik K, et al. (2017) Trans arterial chemoembolization (TACE) with degradable starch microspheres (DSM) in hepatocellular carcinoma (HCC): multi-center results on safety and efficacy. Oncotarget 8: 72613–72620. [ Ref ]
Albrecht KC, Aschenbach R, Diamantis I, Eckardt N, Teichgräber U (2021) Response rate and safety in patients with hepatocellular carcinoma treated with trans arterial chemoembolization using 40-µm doxorubicin-eluting microspheres. J Cancer Res Clin Oncol 147: 23–32. [ Ref ]
Favoulet P, Cercueil JP, Faure P, Osmak L, Isambert N, et al. (2001) Increased cytotoxicity and stability of Lipiodol-pirarubicin emulsion compared to classical doxorubicin-Lipiodol: potential advantage for chemoembolization of unresectable hepatocellular carcinoma. Anticancer Drugs 12: 801–806. [ Ref ]
Lencioni R, Llovet JM, Han G, Tak WY, Yang J, et al. (2016) Sorafenib or placebo TACE with doxorubicin-eluting beads for intermediate stage HCC: The SPACE trial. J Hepatol 64: 1090–1098. [ Ref ]
Liang B, Zhao D, Liu Y, Guo X, Zhang H, et al. (2020) Chemoembolization of liver cancer with doxorubicin loaded CalliSpheres microspheres: plasma pharmacokinetics, intra-tumoral drug concentration, and tumor necrosis in a rabbit model. Drug Deliv. Transl. Res 10: 185–191. [ Ref ]
Dhanasekaran R, Kooby DA, Staley CA, Kauh JS, Khanna V (2010) Comparison of conventional trans arterial chemoembolization (TACE) and chemoembolization with doxorubicin drug eluting beads (DEB) for unresectable hepatocellular carcinoma (HCC). J Surg Oncol 101: 476– 480. [ Ref ]
Costoya J, Surnar B, Akil A, Kolishetti N, Dhar S (2022) Controlled release nanoplatforms for three commonly used chemotherapeutics. Molecular Aspects of Medicine 83: 101043. [ Ref ]
Greten TF, Lai CW, Li G, Staveley-O’Carroll KF (2019) Targeted and Immune-Based Therapies for Hepatocellular Carcinoma. Gastroloenterology 156: 510–524. [ Ref ]
Liu S, Ou MC, Tsai YS, Lin XZ, Wang CK, et al. (2015) Trans arterial Chemoembolization Using Gelatin Sponges or Microspheres Plus Lipiodol-Doxorubicin versus Doxorubicin-Loaded Beads for the Treatment of Hepatocellular Carcinoma. Korean J Radiol 16: 125–132. [ Ref ]
Kloeckner R, Weinmann A, Prinz F (2015) Conventional transarterial chemoembolization versus drug-eluting bead trans arterial chemoembolization for the treatment of hepatocellular carcinoma. BMC Cancer 15: 465. [ Ref ]
Viedma-Martinez M, Villegas -Romero I (2022) Skin necrosis after transarterial chemoembolization. N Engl J Med 387: 2268. [ Ref ]
Prajapati HJ, Xing M, Spivey JR, Hanish SI El-Rayes BF, et al. (2014) Survival, efficacy, and safety of small versus large doxorubicin drugeluting beads TACE chemoembolization in patients with unresectable HCC. Am J Roentgenol 203: W706–14. [ Ref ]
Zheng S, Zhou S, Qiao G, Yang Q, Zhang Z, et al. (2015) Pirarubicin-based chemotherapy displayed better clinical outcomes and lower toxicity than did doxorubicin-based chemotherapy in the treatment of nonmetastatic extremity osteosarcoma. Am J Cancer Res 5: 411–422. [ Ref ]
Varela M, Real MI, Burrel M, Forner A, Sala M, et al. (2007) Chemoembolization of hepatocellular carcinoma with drug eluting beads: Efficacy and doxorubicin pharmacokinetics. J Hepatol 46: 474– 481. [ Ref ]
Barone FC, Marcinkiewicz CM, Li J, Mark S, Peter IL, et al. (2018) Pilot study on biocompatibility of fluorescent nanodiamond-(NV)-Z~800 particles in rats: safety, pharmacokinetics, and bio-distribution (part III). Int J Nanomedicine 13: 5449–5468. [ Ref ]
Barone FC, Marcinkiewicz C, Li J, Feng Y, Sternberg M, et al. (2019) Long-Term biocompatibility of fluorescent diamonds-(NV)-Z~800nm in rats: survival, morbidity, histopathology and particles distribution and excretion studies (Part IV). Int J Nanomedicine 14: 1163–1175. [ Ref ]
Gerstenhaber JA, Marcinkiewicz C, Barone FC, Sternberg M, Lelkes PI, et al. (2019) Biocompatibility studies of fluorescent diamond particles- (NV)~800nm (Part V): In vitro kinetics and in vivo localization in rat liver following long term exposure. Int J Nanomedicine 14: 6451–6464. [ Ref ]
Purtov K, Petunin A, Inzhevatkin E, Burov A, Ronzhin N, et al. (2015) Biodistribution of different sized nanodiamonds in mice. J Nanosci Nanotechnol 15: 1070–1075. [ Ref ]
Firestein R, Marcinkiewicz C, Nie L, Burov A, Ronzhin N, et al. (2021) Pharmacodynamic Studies of Fluorescent Diamond Carriers of Doxorubicin in Liver Cancer Cells and Colorectal Cancer Organoids. Nanotechnology Sci Appl 14: 139–159. [ Ref ]
Brown ZJ, Heinrich B, Greten TF (2018) Mouse models of hepatocellular carcinoma: an overview and highlights for immunotherapy research. Nat Rev Gastroenterol Hepatol 15: 536–554. [ Ref ]
Hu X, Chen R, Wei Q, Xu X (2022) The Landscape of Alpha Fetoprotein in Hepatocellular Carcinoma: Where Are We? Int J Biol Sci 18: 536–551. [ Ref ]
Hanif H, Ali MJ, Susheela AT, Khan IW, Luna-Cuadros MA et al. (2022) Update on the applications and limitations of alpha-fetoprotein for hepatocellular carcinoma World J Gastroenterol 28: 216–229. [ Ref ]
Blidisel A, Marcovici I, Coricovac D, Hut F, Dehelean CA, et al. (2021) Experimental Models of Hepatocellular Carcinoma-A Preclinical Perspective. Cancers (Basel) 13: 3651. [ Ref ]
Shafei A, El-Bakly W, Sobhy A, Wagdy O, Reda A, et al. (2017) A review on the efficacy and toxicity of different doxorubicin nanoparticles for targeted therapy in metastatic breast cancer. Biomed Pharmacother 95: 1209–1218. [ Ref ]
Kettenbach I, Stadler A, Isabella V, Schernthaner R, Blum M, et al. (2008) Drug-Loaded Microspheres for the Treatment of Liver Cancer: Review of Current Results. Cardiovasc Intervent Radiol 31: 468–476. [ Ref ]
Sohail M, Sun Z, Li Y, Gu X, Xu H (2021) Research progress in strategies to improve the efficacy and safety of doxorubicin for cancer chemotherapy. Expert Rev Anticancer Ther 21: 1385–1398. [ Ref ]
Reineck P, Torelli M (2019) Fluorescent Nanomaterials for Bioimaging: Consideration of Particle Brightness, Photostability, and Size. Material Matters 14: 2. [ Ref ]
Rabinowitz SS, Gordon S (1991) Macrosialin, a macrophage-restricted membrane sialoprotein differentially glycosylated in response to inflammatory stimuli. J Exp Med 175: 309. [ Ref ]
Chistiakov DA, Killingsworth MC, Myasoedova VA, Orekhov AN, Bobryshev YV (2017) CD68/macrosialin: not just a histochemical marker Lab Invest 97: 4–13. [ Ref ]
Ding W, Tan Y, Qian Y, Xue W, Wang Y, et al. (2019) Clinicopathologic and prognostic significance of tumor-associated macrophages in patients with hepatocellular carcinoma: A meta-analysis. PLOS ONE Oct 14: e0223971. [ Ref ]
Yang L, Liu L, Zhang R, Hong J, Wang Y, et al. (2020) IL-8 mediates a positive loop connecting increased neutrophil extracellular traps (NETs) and colorectal cancer liver metastasis. Cancer 11: 4384–4396. [ Ref ]
Liu Y, Cao X (2016) Organotrophic metastasis: role of tumor exosomes. Cell Research 26: 149–150. [ Ref ]
Zhang M, Shi R, Guo Z, He J (2020) Cancer-associated fibroblasts promote cell growth by activating ERK5/PD-L1 signaling axis in colorectal cancer. Pathol Res Pract 216: 152884. [ Ref ]
Lee YT, Fujiwara N, Yang JD, Hoshida Y (2023) Risk stratification and early detection biomarkers for precision HCC screening. Hepatology 78: 319–362. [ Ref ]
