Journal Name: Journal of Biomedical Research and Reviews
Article Type: Analysis
Received date: 12 August, 2020
Accepted date: 09 September, 2020
Published date: 2021-03-21
Citation: Jiang Z, Shi Y, Wang Z, Tan G (2020) Comprehensive Analysis Reveals a Six-Gene Signature and Associated Drugs in Alzheimer Disease. J Biomed Res Rev Vol: 3, Issu: 2 (23-31).
Copyright: © 2020 Wang Z, et al. This is an open-access article distributed under the terms of the Creative Commons Attribution License, which permits unrestricted use, distribution, and reproduction in any medium, provided the original author and source are credited.
Abstract
Background: Alzheimer disease (AD) is a progressive neurodegenerative disease caused by many factors. The essential genes and signaling pathways involved in the pathogenesis of AD are still unknown. The purpose of our research is to analyze and screen out potential molecular biomarkers and available drugs.
Methods: We obtained the gene expression profile of GSE18309 from the gene expression Omnibus website. Then, we used the Limma package in Rstudio to screen out differentially expressed genes (DEGs), followed by the corresponding cell signal pathway enrichment using DAVID analysis. Finally, STRING used to obtain the protein-protein interaction (PPI) network and the corresponding hub gene obtained through MCODE of Cytoscape software. And the significant gene modules were chosen for further gene-drug interaction analysis. Finally, the existing drugs target to these module genes were screen to explore the therapeutic effect for the treatment of Alzheimer disease.
Results: The results showed that a total of 119 upregulated genes and 160 downregulated genes were identified, which met the criteria of |log2 changes| ≥2, adjusted P value <0.01. Through the PPI network, the hub gene module we obtained shows that genes such as GNG13, EDNRB, CHRM3, CCKAR, FFAR4, and TRIO. Among them, six antipsychotics drugs, ARIPIPRAZOLE, OLANZAPINE CLOZAPINE, PROMAZINE, CHLORPROTHIXENE, and LEVOMEPROMAZINE, have targeted to CHRM3 gene.
Conclusions: In the paper, we identified six potential genes and six drugs for Alzheimer disease, which might be used as targets and drugs for the study of Alzheimer disease.
Keywords
Differentially Expressed Genes, Biomarkers, Alzheimer disease, Bioinformatical analysis.
Introduction
Alzheimer’s disease (AD) is a progressive neurodegenerative disease that is gradually known to everyone. Its clinical manifestations are mainly cognitive dysfunction, commonly known as forgetfulness, which eventually leads to Alzheimer’s disease. It is also a major fatal disease affecting the elderly One. Numerous evidence in the past show that genetic factors, immune factors, environmental factors, depression, high blood pressure, etc. may be significantly related to the occurrence and development of AD [1-6]. At the same time, it is estimated that genetic factors account for the risk of AD 70% [7]. Although substantial progress has been made in basic experiments and clinical research on AD, its etiology is still unknown. It is worth noting that the treatment of AD can only improve symptoms to a certain extent and will not hinder the progress of the disease [8]. At present, due to the increasing incidence of AD in the elderly and poor prognosis, it is urgent to reveal the etiology and molecular characteristics of AD disease, discover molecular biomarkers of AD disease, and provide the basis for early diagnosis, prevention and AD disease New treatment strategies.
In recent years, high-throughput sequence techniques such as microarray or RNA-seq chip used to analyze differential gene expression and variable splicing variation have been increasingly regarded as essential techniques with significant clinical application prospects in tumor medicine as molecular diagnosis, drug target discovery, prognosis prediction, etc. A public database, the integrated gene expression database (GEO), supported by the national center for biotechnology information (NCBI), contains profiles of disease gene expression from dozens of basic experiments. The GEO database is widely used to identify key genes and potential mechanisms for the occurrence of disease and development [9]. Although the pathogenesis of AD has been studied in recent years, the pathogenesis and molecular mechanisms of AD progression remain controversial. Therefore, we need to use gene expression chips to export the data from these analyses to modern pathway analysis software, which can find meaningful clues to a new understanding, such as new diagnostic markers and therapeutic targets [10].
In this study, we downloaded one AD microarray dataset (GSE18309) from the Gene Expression Omnibus database (GEO, http://www.ncbi.nlm.nih.gov/geo/), and we used three AD samples and three normal control samples for DEGs analysis. Subsequently, the differentially expressed genes (DEGs) were screened using R software (version 3.6.3) installed Limma packages [11,12]; later, Venny online tool was used for further comprehensive analysis. Then gene ontology (GO) and pathway enrichment were analyzed on DAVID’s website (https://david.%20ncifcrf.gov) [13]. By analyzing their critical cellular signaling pathways and biological functions, a string database was used to generate protein-protein interaction networks (PPI). In summary, the above analysis identified several essential AD-related genes and pathways and further identified potential candidates for diagnostic, prognostic, and therapeutic treatment.
Methods
Data collection
From the National Biotechnology Information Center (NCBI) Gene Expression Comprehensive (GEO) Database [9,14], we downloaded the gene expression chip data GSE18309 [39] we need to analyze. The data GSE18309 was uploaded by Kuang-Den Chen et al., using the Affymetrix GPL570 platform (Affymetrix Human Genome U133 Plus 2.0 Array) as a reference. We selected three AD samples and three normal control samples to analyze and identify the hub gene and signaling pathway.
Data Preprocessing
After obtaining GSE18309, firstly, the obtained pr obe identification numbers (IDs) are converted into gene symbols or translators by R software. Then, the same gene should be processed corresponding to multiple probes, and the most significant expression value is taken as the gene expression value. Next, the non-mRNA probe is deleted from it. Finally, through the Affy package, the obtained gene expression value was normalized, and the signal intensity of the gene was converted by log2 and normalized [14,16].
Identification of DEGs
We use linear models to evaluate differential expressions and to analyze design experiments. Use the linear models for microarray data (limma) package in R software (version 3.6.3) to identify the DEGs based on a series of matrix files and respectively divide into upregulated genes and downregulated genes. Significant DEGs were selected for further analysis by cut-off criterion (|log2 variation (FC)|≥2 and adjusted P value <0.01) [41].
Gene ontology analysis of DEGs and KEGG pathway analysis
Gene Ontology (GO) provides a standard vocabulary of corresponding terms with annotations that illuminate the characteristics of genetic products. The GO term reflects the current understanding of genes in terms of biological processes (BP), cell composition (CC), and molecular function (MF) [18,19]. Also, the Kyoto Encyclopedia of Genes and Genomes (KEGG) [20] provides a large number of data resources of known biological pathways, which are annotated as a gene or a group of genes/proteins with their respective KEGG pathways. To interpret the function and signal pathway analysis of DEGs. We use a variety of online tools for functional and pathway enrichment analysis [13]. For example, DAVID is an online site that provides genetic annotations, visualizations, and genetic attributes. P <0.05 was considered to be statistically significant.
Module analysis, identification of the hub gene, and analysis of the PPI network of the DEGs
The search tool (STRING) was used to demonstrate DEG-encoded protein and protein-protein interaction (PPI) information [21], database for retrieving interacting genes. At first, to assess the interaction between DEGs, we mapped the list of DEGs to the STRING website. Second, the PPIs of DEGs with a comprehensive score of >0.9 (medium confidence) and genes closely related to other genes, and the degree of selection ≥10 [22]. After that, PPI networks were visualized using Cytoscape, and hub genes were identified according to the degree of connectivity between DEGs. The MCODE parameters criteria were set by default, except K-core=5. Besides, the functional enrichment analysis of DEGs of each module was carried out with P <0.05 as the cut-off standard.
Drug-gene interaction and functional analysis of potential genes
To get interaction between genes and the existing drugs and explore the potential application of the new drug indications for a human hernia. The drug-gene interaction database (DGIdb: https://www.dgidb.org) is an opensource and supports searching, browsing, and filtering of information on drug-gene interactions based on over thirty trusted sources [23]. As the potential targets, the module genes were pasted into the drug-gene database to search for existing drugs or compounds. These potential genes which have matched drugs were obtained and also performed functional enrichment analysis.
Statistics analysis
The moderate t-test was applied to identify DEGs; Fisher Exact test was used to analyzed GO and KEGG annotation enrichments. All statistical analyses were executed in R version 3.6.3 software figure 1.
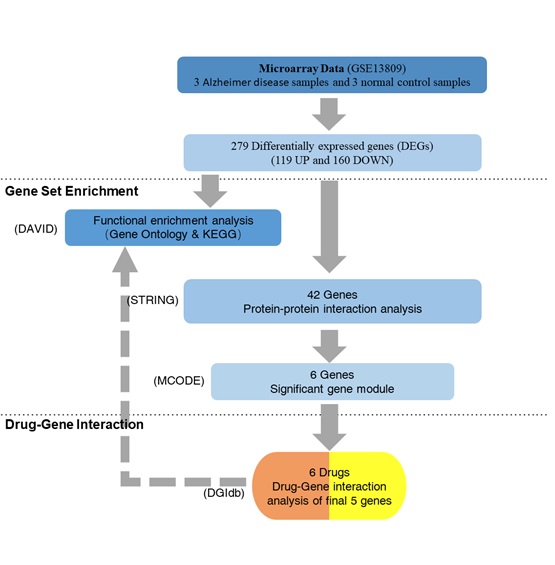
Figure 1: The framework of data analyses.
Results
DEGs identification
In this study, we included three AD samples and three normal control samples for the analysis to identify DEGs linked with AD. The GSE18309 was analyzed using Rstudio software, and the following DEG sets were determined. Using |log2 fold change (FC)|≥ 2 criteria and adjusted P values <0.01, a total of 279 DEGs were identified from the GSE18309 data set, including 119 upward adjustments and 160 downward adjustments (Table 1).
Table 1: 279 Differentially Expressed Genes (DEGs) were identified from GSE62600, including 119 upregulated genes and 160 downregulated genes in the patients with Alzheimer disease, compared to controla.
| DEGs | Gene name |
|---|---|
| Upregulated genes |
LINC00664, PMP2, FAM170B, CLDN11, VPS33A, RTP3, HIF3A, SLC4A1, RBM43, TTC28-AS1, KRT17P5, AHNAK, SLC17A8, MAP2K7, FREM1, HSD17B12, ABCC11, MYH3, KITLG, OR9A1P, CDC42BPA, PPP5D1, TNS1, TPM1, GJA10, EGLN2, OPRM1, SMAD5-AS1, TRABD2A, FOXO3, MAATS1, GPR161, CASC15, IFNW1, ADGRD2, DLGAP1, GNG13, ALDH4A1, MEG3, MEP1A, ARPP21, SLC6A8, VWDE, ANKUB1, CXCL3, DAZAP2, NTNG1, GPX8, C11orf96, ZNF425, TBX5, UST-AS1, ZNF135, KCNQ1, DAOA-AS1, ASCL1, METAP1D, C21orf58, SUCLG2-AS1, NRP2, ANKRD29, SORBS2, ITIH3, KDSR, IL22RA2, POLN, SPINK13, FZD10, AGAP11, ANKRD13C, DOCK6, TRIO, CACNA2D1, ALAS2, SYN2, SARM1, RAD51B, RBPMS2, GRIP2, BTG4, FGF14, CRMP1, KCNE4, LRP12, UNC13C, FITM2, RPL35A, CRHR1, PRO2958, HMGA2, C1orf101, KCNMB2, PDIA2, COL5A1, CYP2A13, PPEF1, RAG2, PDE1C, CLCN7, CALCRL, CHRM3, BGLT3, SOX6, SLC6A11, ZNF462, GPR158, CDH8, DIRC1, CXCL11, TMCO5B, SOBP, DPPA5, TEAD4, SEMA6D, HTN3, MAMDC2, HGD, LMO7DN, PDLIM3 |
| Downregulated genes |
ZMYND11, ARL10, EGFEM1P, FFAR4, CAPRIN2, KIAA1462, PAQR9, EMP2, CYMP, PGM5, HLA-DOA, TMPRSS5, PREX2, NARF, M4SF20, LAMB4, CAMK2N1, CAPN13, MTMR1, PLCE1, SMARCA2, PCDH7, COL4A5, MAGEA4, BNC1, SNORD8, CLIP1-AS1, FBXO4, SERTAD4, CEP152, DNMBP, EDNRB, POLR3G, LMBRD2, ITGB2, GIPC3, TPD52L1, BTN1A1, ILDR2, MAP1B, PDE4A, CES1P1, IGFBP2, C2CD2L, TMEM217, DSEL, RCBTB2, ADCY10, MIR670HG, CSRP2, ZNF233, KCNK1, IL17A, PLEKHB1, CACNA1B, PDLIM4, TAT, ACTG1P17, CBR3-AS1, GPRC5B, LAYN, ITGA11, NAALAD2, ATXN7L1, UNC80, SLC30A7, SRRM5, GJC1, ZNF81, POU3F2, SPATA45, TLE1, M1AP, RHOJ, DAW1, LRRC34, NKAPP1, ARR3, TBC1D16, CRNN, INTS1, CRISP1, P2RX6, ZIC5, SYNPO2, SPON1, COX11, PER4, SERPINB13, TONSL, 730101, SPANXA2-OT1, SULT1E1, PMCHL2, EPS8L2, ZNF519, RASEF, DNAH6, GSTA3, TNXB, COL10A1, JUN, LARGE-AS1, FLRT3, MICALL2, CDKN2D, CETN1, MUC3B, C7orf77, NOX1, MAGI1, KIAA0087, FOXI1, ANKRD53, NLGN4X, CABP2, FOXP3, TLDC1, ACVR1B, CCKAR, ATP8B3, WNT5A, LAMA4, CEP70, PPARGC1B, PRSS35, CENPA, C9orf116, KIAA1549, LIMK1, AMFR, CCNY, CASD1, ZNF214, ADAM22, LACE1, MYO7B, ZNF709, IL6ST, STX19, TPT1-AS1, FCGR2C, PATJ, DENND5B, ZNF264, PREPL, GABRA2, DNAJB8-AS1, NDST4, AKR1D1, SAV1, PER2, PCSK2, PHKG1, ZNF595, LRRTM1, TRPC2, FAM64A, CSPG4, CNBD1 |
| aThe upregulated genes were listed from the largest to the smallest of fold changes, and downregulated genes were listed from the smallest to largest. | |
Function and signal pathway enrichment analysis
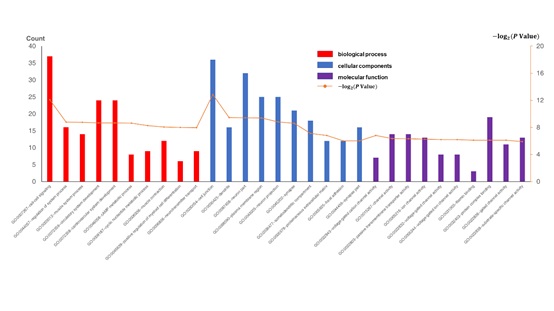
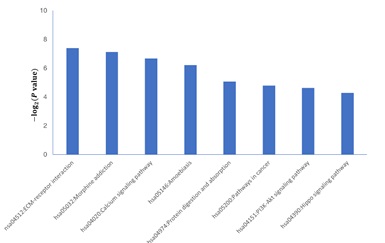
To further explore the potential significance of these identified DEGs in AD, We upload the filtered DEGs to the DAVID website and set the key standard to P <0:05 to analyze and identify GO terms and KEGG pathway, which was divided into three functional groups: cell component (CC), molecular function (MF), and biological process (BP). The results in figure 2 show the following six most important terms: BP, CC, and MF for DEGs, respectively. We also show the annotations of upregulated genes and downregulated genes in detail. As shown in table 2, within the BP, the upregulated DEGs were mainly related to the regulation of voltage-gated calcium channel activity, regulation of ion transmembrane transport, and cell-cell signaling, and the downregulated DEGs were primarily related to the regulation of phosphorylation, regulation of protein modification process, and regulation of protein phosphorylation. Within the CC, the upregulated DEGs were mainly related to contractile fiber part, myofibril, and contractile fiber, and the downregulated DEGs were mainly related to cell junction, dendrite, and neuron part. Within the MF, the upregulated DEGs were mainly related to heparin binding, structural constituent of muscle, and voltage-gated ion channel activity, and the downregulated DEGs were mainly related to protein kinase regulator activity, protein complex binding, and kinase regulator activity. KEGG analyzed the cellular signaling pathway represented by 279 DEGs. Figure 3 shows the most significant enrichment pathways for DEGs. And table 2 lists the significant enrichment pathways for the downregulation of DEGs, while there are no available significantly enriched pathways of the upregulated DEGs. Among them, the downregulated DEGs were mainly enriched in the ECM-receptor interaction, Amoebiasis, and Calcium signaling pathway.
Figure 2: All available significant gene ontology enrichment terms of the differentially expressed genes (DEGs).
Figure 3: Significantly enriched signal pathway of differentially expressed genes (DEGs) in Alzheimer disease.
Table 2: The significant gene ontology and KEGG enrichment terms of Upregulated and downregulated DEGs, respectively.
| Category | Term | Count | P Value |
|---|---|---|---|
| Upregulated DEGs | |||
| GOTERM_BP_FAT | GO:1901385~regulation of voltage-gated calcium channel activity | 4 | 5.55E-04 |
| GOTERM_BP_FAT | GO:0034765~regulation of ion transmembrane transport | 9 | 0.001566964 |
| GOTERM_BP_FAT | GO:0007267~cell-cell signaling | 19 | 0.001651788 |
| GOTERM_CC_FAT | GO:0044449~contractile fiber part | 6 | 0.00737112 |
| GOTERM_CC_FAT | GO:0030016~myofibril | 6 | 0.008457733 |
| GOTERM_CC_FAT | GO:0043292~contractile fiber | 6 | 0.010571241 |
| GOTERM_MF_FAT | GO:0008201~heparin binding | 5 | 0.014668566 |
| GOTERM_MF_FAT | GO:0008307~structural constituent of muscle | 3 | 0.025277132 |
| GOTERM_MF_FAT | GO:0005244~voltage-gated ion channel activity | 5 | 0.025293473 |
| Downregulated DEGs | |||
| GOTERM_BP_FAT | GO:0042325~regulation of phosphorylation | 23 | 3.63E-04 |
| GOTERM_BP_FAT | GO:0031399~regulation of protein modification process | 25 | 7.10E-04 |
| GOTERM_BP_FAT | GO:0001932~regulation of protein phosphorylation | 21 | 9.64E-04 |
| GOTERM_CC_FAT | GO:0030054~cell junction | 23 | 3.39E-04 |
| GOTERM_CC_FAT | GO:0030425~dendrite | 10 | 0.007006 |
| GOTERM_CC_FAT | GO:0097458~neuron part | 19 | 0.007583 |
| GOTERM_MF_FAT | GO:0019887~protein kinase regulator activity | 6 | 0.009196 |
| GOTERM_MF_FAT | GO:0032403~protein complex binding | 13 | 0.011479 |
| GOTERM_MF_FAT | GO:0019207~kinase regulator activity | 6 | 0.013991 |
| KEGG_PATHWAY | hsa04512:ECM-receptor interaction | 5 | 0.002395 |
| KEGG_PATHWAY | hsa05146:Amoebiasis | 5 | 0.004886 |
| KEGG_PATHWAY | hsa04020:Calcium signaling pathway | 6 | 0.005933 |
| GO, gene ontology; KEGG, Kyoto Encyclopedia of Genes and Genomes. | |||
Module screening from the PPI network
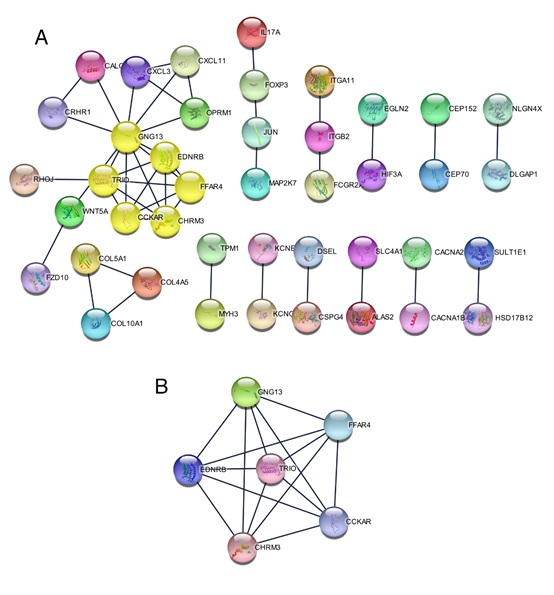
DEGs were analyzed by STRING online database (http:// string-db.org) and Cytoscape software, a total of 279 DEGs (119 upregulated and 160 downregulated genes) were screened into the DEG PPI network complex, including 42 nodes with 44 edges and a score of > 0.900 (highest confidence) (Figure 4A). Afterward, based on MCODE, select the prominent modules in the PPI network (6 nodes, 15 edges, Figure 4B), which three upregulated genes (GNG13, CHRM3, and TRIO), and three downregulated genes (GNG13, CCKAR, and FFAR4).
Figure 4: The protein-protein interaction (PPI) networks construction and significant gene modules analysis. (A) Based on the STRING online database, 42 DEGs were filtered into DEGs PPI network. (B) The most significant module from the PPI network.
Drug-gene interaction and functional analysis of potential genes
The six potential genes clustered in the significant gene module 1 were selected for drug-gene interaction analysis. In human species, after our screening, we found that there was CHRM3 target to six potential existing antipsychotics drug, namely aripiprazole, olanzapine, clozapine, promazine, chlorprothixene and levomepromazine.
Discussion
It is well known that AD is a genetically complex neurodegenerative disease characterized by the formation of extracellular senile plaques amyloid-β (Aβ) peptides, intracellular neurofibrillary tangles (non-functional testing), and structure Brain regions related to functional changes and memory [24-26], Alzheimer’s disease affects the quality of life of patients, is not conducive to the lives of patients, and places a heavy burden on patients’ families and the entire society. However, at present, the pathogenesis of AD and effective treatments for AD patients is rare. Therefore, in this study, we hope to screen out key candidate genes and signaling pathways of early AD. We found 119 upregulated DEGs and 160 downregulated DEGs by comparing the three AD sample with three normal control samples. Through GO, KEGG, and PPI network analysis, we have identified hub genes such as GNG13, EDNRB, CHRM3, CCKAR, TRIO, and FFAR4, coupled with the ECM-receptor interaction signaling pathway have been identified.
We have listed these selected genes. In previous studies, it was only found that the disorder of GNG13 is related to breast cancer disease plan [27]. In the study of sun [28] and others, it was found that GNG13 may play an essential role in the development of prostate cancer. EDNRB’s involvement in the event of nerve cells and glial cells has been confirmed in fetal and adult brains. EDNRB activation in the brain increases the proliferation of neurons and astrocytes, increases the expression of cytoskeletal proteins in astrocytes, and increases neurotrophic factors’ production by astrocytes [29]. These results indicate that the loss of EDNRB function leads to a significant decrease in cell proliferation and increased apoptosis in all subregions of the hippocampus and dentate gyrus. EDNRB plays a vital role in the proliferation of normal cells in the rat hippocampus [30]. Schmidt et al. found that CCKAR has a certain correlation with schizophrenia and is related to the regulation of ischemia-hypoxia [31]. Evidence suggests that FFAR4 has a role in regulating energy balance, including controlling blood sugar and intestinal hormone secretion [32]. Current research shows that sustained FFAR4 stimulation in the brain can reduce anxiety behaviors, thus indicating that FFAR4 acts as a potential pathway through omega-3 (ω- 3) polyunsaturated fatty acids (PUFA) central anti-anxiety behavior [33]. It is recognized that TRIO plays an important role in cell division, cell migration, and other functions and plays a role in synapse formation by regulating excitatory synaptic transmission [34-36]. Previous mouse experiments, found that the lack of heterozygosity or homozygosity of TRIO in the hippocampus will lead to progressive defects in their learning and social skills [37-39].
As for the CHRM3 gene, which is a cholinergic receptor and is related to schizophrenia, it may be a potential therapeutic target for COPD patients [40,41]. And we found six antipsychotic drugs targeting CHRM3. Aripiprazole is an atypical antipsychotic drug approved for schizophrenia in adults and adolescents, mania in children and adults with bipolar disorder, autism, and major depression in adults. In several experiments, it was found that aripiprazole is more effective in controlling behavioral symptoms in AD patients [42,43]. The results of the cohort study experiment by Vigen et al. Showed that AD patients treated with olanzapine had a significant decrease in the cognitive summary score and mini mental state examination (MMSE). The effect is obvious [44]. At the same time, in the study of Zheng et al., It was found that aripiprazole combined with olanzapine was effective in treating elderly Alzheimer’s disease with mental disorders. It promotes the recovery of nerve function and produces a lower incidence of adverse reactions [45]. In another experiment, it was found that the treatment of AD mice with CLOZAPINE can improve memory impairment and Aβ generation during amyloid formation [46]. Promethazine is one of the most commonly used antipsychotic drugs [47], but there is no relevant report showing the correlation between promethazine and AD. At the same time, we searched the literature to find that CHLORPROTHIXENE and LEVOMEPROMAZINE have any connection with the treatment of AD, and the previous research of the first four drugs seems to remind us that the two may play some role in the development of AD Unknown role.
In short, in this article, we explored potential essential candidate genes and critical signaling pathways for DEGs in the occurrence and development of AD. Through commonly used analysis methods, key candidate genes and signal pathways are gradually screened by the analysis sequence of DEG, GO, KEGG, and PPI. Then through drug-gene interaction analysis, we identified six existing antipsychotic drugs. Our research has improved our understanding of the occurrence mechanism and potential molecular mechanisms of AD; these selected candidate genes, signaling pathways, and potential therapeutic drugs may provide us with clues for new AD diagnostic strategies, targeted therapy, and prognostic analysis. However, to determine whether these genes are related to the occurrence and development of AD and whether these drugs can delay or prevent the progress of AD, it needs to be further confirmed by molecular biology, cell experiments, and even clinical trials. This study has certain limitations. For example, the lack of correlation analysis between these genes and clinical information requires basic experiments to explore the role of these genes in AD.
Conclusion
Through applying a series of bioinformatics methods to gene expression profiling, we acquired 6 potential biomarkers (GNG13, CHRM3, TRIO, GNG13, CCKAR, and FFAR4) and six antipsychotics drug (ARIPIPRAZOLE, OLANZAPINE, CLOZAPINE, PROMAZINE, CHLORPROTHIXENE and LEVOMEPROMAZINE), which will provide insight for new study targets and new drug indications.
Declarations
Funding
No funding was received for this article.
Consent for publication
All authors agreed to publish
Availability of data and material
All data are repeatable
Authors’ contribution
Conception and design of the research: Zhengye Jiang; acquisition of data: Zhengye Jiang; analysis and interpretation of data: Guowei Tan; statistical analysis: Tanguo Wei; drafting the manuscript: Zhengye Jiang; revision of manuscript for important intellectual content: Zhanxiang Wang. All authors read and approved the final manuscript.
Acknowledgement
None
Availability of data and material
The datasets used and analyzed during the current study are available from the corresponding author on reasonable request.
Competing interests
The authors declare that they have no competing interests
Ethics approval and consent to participate
None
There are no references


