Journal Name: Journal of Biomedical Research and Reviews
Article Type: Analysis Article
Received date: 28-February-2022
Accepted date: 23-June-2022
Published date: 30-June-2022
Citation: Ji L, Li X, Wang Q, Zheng J, Liu X, et al. (2022) Identification and Validation of a Novel Multi-Omics Signature for Prognosis and Immunotherapy Response of Endometrial Carcinoma. J Biomed Res Rev Vol: 5, Issu: 1. (28-38)
Copyright:© 2022 Ji L et al. This is an open-access article distributed under the terms of the Creative Commons Attribution License, which permits unrestricted use, distribution, and reproduction in any medium, provided the original author and source are credited.
Abstract
Introduction: Cancer development and immune escape involve DNA methylation, copy number variation and other molecular events. However, there are remarkably few studies integrating multi-omics genetic profile in endometrial cancer (EC). We aimed to develop a multi-omics signature for prognosis and immunotherapy response of endometrial carcinoma. Material and methods: We analysed the gene expression, somatic mutation, copy number alteration and DNA methylation data of EC from UCSC Xena database. Then, a multi-omics signature was constructed by machine learning model, ROC curve comparing its prognostic power with traditional clinical features. Two computational strategies were utilized to estimate the signature’s performance in predicting immunotherapy response in EC. Further validation focused on the most frequently mutant molecule, ARID1A, in the signature. Association of ARID1A with survival, MSI (Microsatelliteinstability), immune checkpoints, TIL (tumor infiltrating lymphocyte) and downstream immune pathways were explored. Result: The signature consisted of 22 multi-omics molecules, showing excellent prognostic performance in predicting the overall survival of patients with EC (AUC= 0.788). After stratifying patients into high and low risk group according to the signature’s median value, low risk patients displayed a greater possibility to response to immunotherapy. Further validation on ARID1A suggested it could induce immune checkpoints up-regulation, promote interferon response pathway and interact with Treg (regulatory T cell) to facilitate immune activation in EC. Conclusion: A novel multi-omics prognostic signature of EC was identified and validated in this study, which could guide clinical management of EC and benefit personalized immunotherapy.
Keywords
Prognosis, Immunotherapy, Endometrial Carcinoma, ARID1A, Regulatory T cell.
Abbreviation
EC: Endometrial Carcinoma; TCGA-UCEC: The Cancer Genome Atlas-Uterine Corpus Endometrial Carcinoma cohort; ICB: Immune Checkpoint Blockade; CNV: Copy Number Variation; MSI: Microsatellite Instability; MSI: Microsatellite-instability; TIL: Tumor Infiltrating Lymphocyte; DEG: Differentially Expressed Genes; OS: Overall Survival; PFS: Progression Free Survival.
Introduction
As the most prevalent gynecologic malignancy, endometrial carcinoma (EC) is one of the leading cause of female mortality worldwide [1]. The introduction of ICB (Immune Checkpoint Blockade) has achieved favorable clinical effect in patients with end-stage EC where chemotherapy regimen has little progression [2,3]. However, more than 80% of patients are non-responder, or NDB (no durable clinical benefit), to immunotherapy and the underlying factors resulting in heterogeneous prognoses are poorly understood. In fact, cancer development and immune response are determined by multiple factors, including genomic mutation, DNA methylation and copy number variance, et al [4,5]. Therefore, analysis incorporating multiomics data is urgently needed for EC management.
We utilized meta-dimensional strategies to seek genetically susceptible molecules from gene expression, somatic mutation, copy number alteration and DNA methylation data of EC, aiming to develop a multi-omics signature for prognosis and immunotherapy response of EC. The signature was built by machine learning model and its efficiency was compared with traditional clinical features. Two computational approach were also deployed to estimate the signature’s performance in predicting immunotherapy response. Further validation focused on the most frequently mutant molecule of the signature: ARID1A. Association of ARID1A with survival, MSI (Microsatellite-instability), immune checkpoints, TIL (tumor infiltrating lymphocyte) and downstream immune pathways were explored and potential mechanisms were given.
The present study constructed a novel multi-omics prognostic signature for prognosis and immunotherapy response of EC, which could guide clinical management of EC and benefit personalized immunotherapy.
Material and Methods
Data acquisition
Multi-omics data of EC (endometrial carcinoma) were acquired from TCGA-UCEC cohort (The Cancer Genome Atlas Endometrial Cancer, 543 tumor and 35 normal samples) at UCSC Xena website (https://xenabrowser.net/datapages/), including datasets of Copy Number Variation (CNV), DNA methylation (450k), RNA-seq of raw counts, Somatic Mutation (MuTect2 method) and survival data. In parallel, gene sets of 482 mutated genes with alteration frequency > 5% and 380 copy number varied genes with alteration frequency > 1% in EC were retrieved from Cbioportal (www. cbioportal.org) and OncoKB database (http://oncokb.org).
Differential expression and function enrichment anlaysis
To reveal the molecules of real value for EC in these multi-omics datasets, a series of R packages were used for screening, such as limma package to seek out differentially expressed genes between 543 tumors and 35 normal samples with |log2 Fold Change (FC)| > 1.5 and P value < 0.05 as the threshold, as well as ChAMP package to identify differential methylation loci with |log2 Fold Change (FC)| > 0.5 and P value < 10-15 [6,7].
Heatmap and volcano plot were used to display the 457 differentially expressed genes (DEG) and 746 CpG sites between tumor and normal samples, with GO (http://wego. genomics.org.cn) and KEGG (http://wego.genomics.org.cn) enrichment analysis to dissect their biological function and related signaling pathways. Meanwhile, Oncoprint-plot was employed to present the top 30 mutated and copy number varied genes in EC.
Construction of the multi-omics prognostic signature for EC
Subsequent filtration of the 457 significant DEGs, 746 differential methlytion loci, 482 mutated and 380 copy number varied genes were completed by LASSO penalized Cox regression with overall survival as the dependent variable. At last, 22 molecules were adopted for modeling. Next, Kaplan-Meier curves were depicted to show the prognostic power of the 22-gene-signature where risk score of each patient was calculated with the following formula: Σni Coefi*Xi (Coefi: cox regression coefficient, Xi: expression value of corresponding molecule, n=22). Following that, patients were stratified into high and low-risk group according to the median risk score. ROC (receiver operator characteristic) curve and multivariate Cox regression were also used to evaluate its prognostic performance and independent prognostic efficiency.
Relationship of the prognostic signature with immunotherapy response in EC
To assess the relationship of the signature with immunotherapy, algorithms of TIDE (tumor immune dysfunction and exclusion) and ImmuneCellAI were applied to predict patientis’ response to ICB (immune checkpoint blockade) treatment [8,9]. Hundred-percent bar-chart and Heatmap were used to display the response difference to ICB between high and low-risk groups.
Validation on ARID1A for its prognostic ability and association with immunotherapy
Further validation focused on the most frequently mutant molecule in the signature: ARID1A. Association of ARID1A mutation with patients’ survival, MSI (Microsatelliteinstability), immune checkpoints or T cell exhaustion markers (LAG3, SIGLEC15, CTLA4, HAVCR2 (TIM3), PDCD1LG2 (PDL2), CD274 (PD-L1), PDCD1 (PD1), TIGIT) and downstream immune pathways were explored. In addition, impact of ARID1A mutation on the abundances of 22 tumor infiltrating immune cells were assessed by CIBERSORT algorithm.
Underlying mechanism from ARID1A mutation to cancer immune activation
To identify the Underlying mechanism from ARID1A mutation to cancer immune activation, a ternary interaction network was constructed. Firstly, differential expression analysis was carried out between 235 ARID1A-mut samples and 291 ARID1A-wild tumor samples of UCEC cohort, 25 up-regulated and 46 down-regulated DEGs obtained. By performing correlation analyses between the71 DEGs, abundances of 22 immune cells computed by CIBERSORT and enrichment scores of 29 cancer specialized immune pathways quantified by GSVA, the interaction pair of DEGImmune Cell and DEG-Immune Pathway with correlation coefficient > 0.3 were screened out. Further regulating network of 71 DEG, 22 immune cells and 29 immune pathways was completed by Cytoscape software (https:// cytoscape.org/) [10,11].
Statistic and software
Data processing and all analyses were accomplished by R 4.0.4. (Package: limma, ggplot2, survminer, ChAMP, ggcorrplot, GSVA, CIBERSORTx and so on). Chi-square test was used for counting data. Wilcox or Kruskal-Wallis test were applied for comparisons between groups, while Pearson and Spearman rank correlation were adopted to estimate the statistical correlation of parametric or nonparametric variables. Two-sided P < 0.05 was considered as significant threshold for all statistical tests.
Figure 1:Study protocol
Results
Differential expression analysis and enrichment analysis
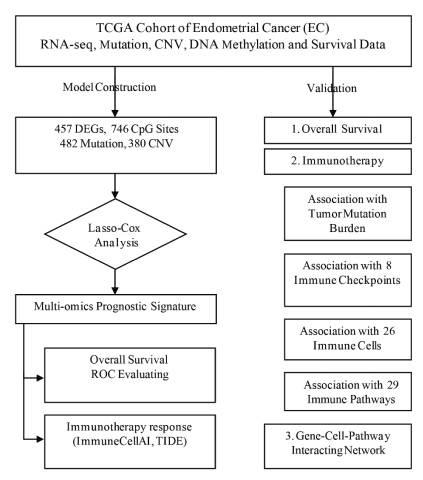
Study protocol was illustrated in figure 1 while table 1 summarized the demographic feature of TCGA-UCEC cohort..
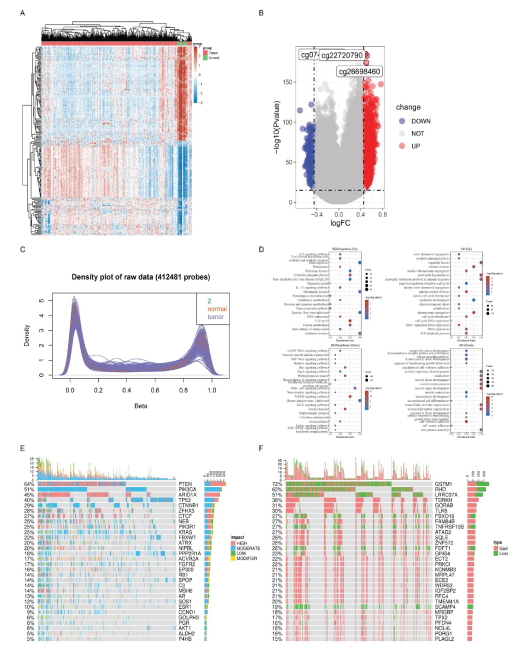
457 differentially expressed genes (DEG) and 746 differential CpG sites were shown in heat map and volcanoplot (Figure 2A, 2B). Those DEGs mainly enriched in thermogenesis and neutrophil activation involved in immune response pathways (Figure 2C, 2D). The top 30 mutant and copy number varied genes were displayed in oncoprint-plot (Figure 2E, 2F).
Construction of the multi-omics prognostic signature
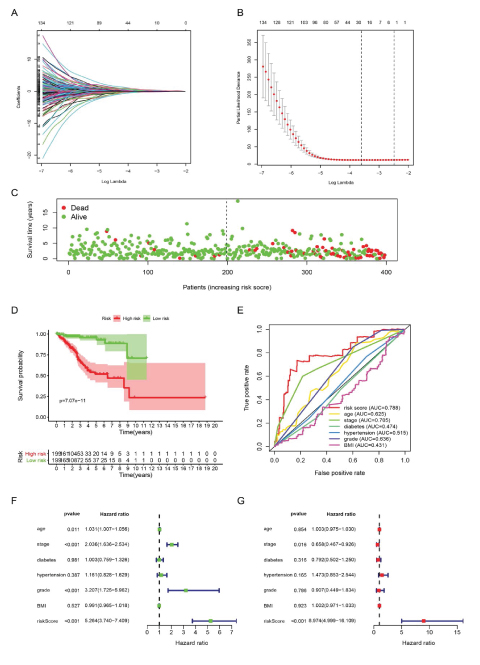
22 molecules stood out in LASSO-Cox analysis after shrinking most factors’ coefficient towards zero (Figure 3A, 3B), including 9 genes with somatic mutation, 4 with copy number variance, 3 with differential CpG sites and 6 DEGs, their regression coefficients shown in table 2. Risk score of each patient was illustrated which well stratified patients into two groups, according to the median value, with huge discrepancy in survival probability (Figure 3C, 3D). ROC curve showed a better prognostic performance of the signature than traditional clinical features, such as pathological stage and tumor grade (Figure 3E). Subsequent univariate and multivariate Cox analyses proved the signature can be an independent factor for prognosis of EC (Figure 3F, 3G).
Figure 2:Differential expression and function enrichment anlaysis. A: Heatmap of 457 DEGs (differentially expressed genes) between tumor and normal samples. B: Volcano-plot of 746 differential CpG sites, 3 most upregulated sites marked. C: Bimodal distribution of Beta value for methylation among tumor and normal samples. D: KEGG and GO enrichment analysis. E: Top 30 mutant genes in EC. F: TOP 30 genes with copy number variance. (UP: up-regulated DEGs; DOWN: down-regulated DEGs, KEGG: Kyoto Encyclopedia of Genes and Genomes; GO: Gene Ontology).
Table 1: Clinical feature of TCGA-UCEC cohort.
| ARID1A-mut | ARID1A-wild | P-value | |
|---|---|---|---|
| SAMPLE | 233 | 288 | |
| AGE | 61.49 ± 10.66 | 65.89 ± 11.02 | <0.001 |
| BMI | 34.11 ± 15.06 | 33.54 ± 9.28 | 0.608 |
| STAGE | 0.009 | ||
| Stage I | 164 (70.39%) | 159 (55.21%) | |
| Stage II | 21 (9.02%) | 29 (10.07%) | |
| Stage III | 44 (18.87%) | 77 (26.73%) | |
| Stage IV | 4 (1.72%) | 23 (7.99%) | |
| DIABETES | 0.76 | ||
| NO | 120 (74.07%) | 138 (72.63%) | |
| YES | 42 (25.93%) | 52 (27.37%) | |
| HYPERTENSION | 0.992 | ||
| NO | 75 (42.37%) | 84 (42.42%) | |
| YES | 102 (57.63%) | 114 (57.58%) | |
| GRADE | 0.025 | ||
| G1 | 52 (22.32%) | 44 (15.28%) | |
| G2 | 58 (24.89%) | 57 (19.79%) | |
| G3 | 121 (51.93%) | 180 (62.50%) | |
| High Grade | 2 (0.86%) | 7 (2.43%) | |
| STATUS | <0.001 | ||
| Alive | 213 (91.42%) | 223 (77.43%) | |
| Dead | 20 (8.58%) | 65 (22.57%) |
Table 2: 22 key molecules identified by LASSO-Cox regression.
| Molecules | Annotation | Coefficient |
|---|---|---|
| ACVR1 (Activin A Receptor Type 1) | Mutation | -0.31351085 |
| ARID1A (AT-Rich Interaction Domain 1A) | Mutation | -0.230538257 |
| ATM (Ataxia Telangiectasia Mutated) | Mutation | -0.095420173 |
| BIRC6 (Baculoviral IAP Repeat Containing 6) | Mutation | -0.13931703 |
| ERBB3 (Erb-B2 Receptor Tyrosine Kinase 3) | Mutation | -0.167684278 |
| HOXA11 (Homeobox A11) | Mutation | 0.340669897 |
| POLE (DNA Polymerase Epsilon) | Mutation | -0.18491545 |
| POLQ (DNA Polymerase Theta) | Mutation | -0.035077258 |
| SPOP (Speckle Type BTB/POZ Protein) | Mutation | -0.094758819 |
| GINS4 (SLD5,GINS Complex Subunit 4) | CNV | 0.058592508 |
| GORAB (Golgin, RAB6 Interacting)) | CNV | 0.074299734 |
| GSTM1 (Glutathione S-Transferase Mu 1) | CNV | 0.172758754 |
| KCNMB3 (Potassium Calcium-Activated Channel Subfamily M Regulatory Beta Subunit 3) | CNV | -0.111711137 |
| PTPN22 (Protein Tyrosine Phosphatase Non-Receptor Type 22) | DEG | -0.074886487 |
| CDH18 (Cadherin 18) | DEG | 0.197447688 |
| KCNK3 (Potassium Two Pore Domain Channel Subfamily K Member 3) | DEG | 0.047114247 |
| NCMAP (Non-Compact Myelin Associated Protein) | DEG | -0.024703756 |
| cg07792478 | CpG of MIR124-2 | 0.327359364 |
| cg13703871 | CpG of ZNF177 | 0.583394392 |
| cg14398860 | CpG of INPP5A | 0.133967149 |
| (CNV: Copy number variance; DEG: Differentially expressed genes). | ||
Relationship of the prognostic signature with immunotherapy response
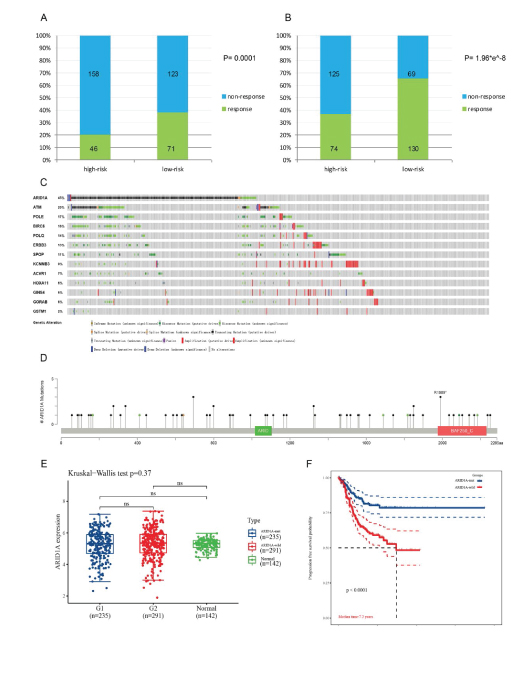
In light of immunotherapy, no matter TIDE or ImmuneCellAI algorithm, more patients in the were seen to be responder of ICB treatment (anti-PD-1 or anti-CTLA4) in the low-risk group than people in the high-risk group (71 vs 46 and 130 vs 74 respectively, P< 0.001) with significant statistic difference (Figure 4A, 4B).
Validation on ARID1A for its prognostic ability and association with immunotherapy
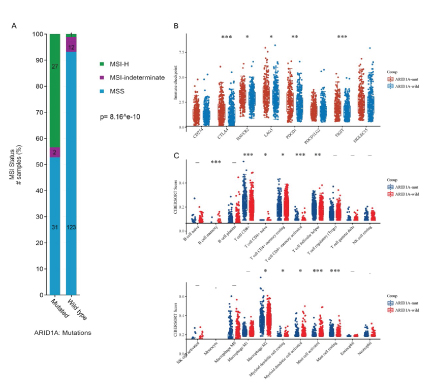
As the most frequently mutant gene in EC (Figure 4C, 4D), ARID1A can well stratify patients into two groups with noticeable survival difference in UCEC cohort (Figure 4E, 4F), though not influencing its mRNA transcription. ARID1A mutation was also associated with MSI-H status, higher level of immune checkpoints expression and TIL (tumor infiltrating lymphocyte) (Figure 5A, 5B, 5C).
ARID1A may interact with Treg and promote Type-I-IFN-Response pathway to facilitate tumor immune activation in EC
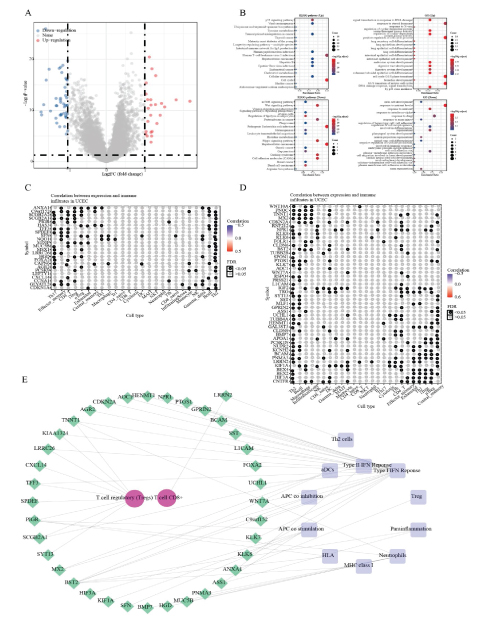
Of the 71 DEGs between ARID1A-mut and ARID1A-wild tumor samples, 25 were up-regulated and 46 were downregulated (Figure 6A). They were mainly enriched into p53 signaling, mTOR, DNA damage and stem cell development signaling pathways (Figure 6B). These DEGs also exhibited extensive association with 22 immune cells and 29 immune pathways in the correlation heatmap (Figure 6C, 6D). Within the final interaction network, Type-I-IFN-Response pathway and T cell regulatory showed major connection with DEGs, indicating that ARID1A may interact with Treg and promote Type-I-IFN-Response pathway to facilitate tumor immune response in EC (Figure 6E).
Discussion
The present study constructed a novel multi-omics prognostic signature for prognosis and immunotherapy response of EC, which could guide clinical management of EC and benefit personalized immunotherapy. Following validation indicated ARID1A mutation may interact with Treg and promote Type-I-IFN-Response pathway to facilitate tumor immune response and better survival outcomes for EC patients.
ARID1A (BAF250a), though connected with a superior outcome of ICB treatment in several cancer types, has rarely been reported for its prognostic and predictive ability in the immunotherapy cohort of EC [12-14]. As a subunit of the SWI/SNF chromatin-remodeling complex, it harbors an N-terminal DNA binding ARID (~110 residues) and a C-terminal folded region (~250 residues), which are essential to increase chromatin accessibility, binding to the promoter regions and facilitating transcription of multiple genes [15,16]. In consistent, majority of DEGs were found to be down-regulated, other than up-regulated, in the ARID1Amut group in our study (46 vs 25), partly accounting for the tumor suppression effect of ARID1A deficiency in a wide range of cancer types [17-19]. These results were in line with the advantageous role of ARID1A mutation for patients’ survival outcome in TCGA-UCEC in this study.
In fact, association between ARID1A mutation and favorable ICB treatment outcome in other cancer types is not scarce. Shen J et al. has reported a greater proportion of ICB response in ARID1A-deficient group than ARID1Awild group in ovarian cancer mouse models [20]. Similar result was also observed in two Melanoma cohorts (42.86 % responder versus 25.81 % non-responder, and 100 % responder versus 51.43 % non-responder respectively) [21-23]. In addition, favorable survival outcome in ARID1A mutant patients when receiving ICB treatment was also revealed in a pan-cancer study, but merely 10 EC samples with ARID1A mutation were included, not sufficient to demonstrate the survival difference [12].
Elsewhere, ARID1A mutation was seen to be involved in Type I IFN (IFN-α/β) response pathway and regulatory T cell to interact with EC development, partly accounting for its advantageous role in many kinds of cancer. Previous study has already linked IFN I and IFN II pathway to ICB therapy outcome in multiple cancers and there was data also connecting ARID1A mutation with IFN I and II response pathway activity [13,24,25]. Apart from IFN pathways, in agreement with our findings, ARID1A mutation could also result in higher level of PD-1, MSI, T cell infiltration to promote cancer immunity, potentiating favorable ICB treatment response [26-28].
Conclusion and Limitation
The present study constructed a novel multi-omics prognostic signature for prognosis and immunotherapy response of EC, which could guide clinical management of EC and benefit personalized immunotherapy. Following validation indicated ARID1A mutation may interact with Treg and promote Type-I-IFN-Response pathway to facilitate tumor immune response and better survival outcomes for EC patients.
Given the inherent fault of bioinformatics analysis— lacking of convincing data from reality, the conclusion of this study may be constrained. Further multi-centric clinical studies and experiments on cell and animal level are warranted to validate the results under different circumstances.
Figure 3: Construction and evaluation of the prognostic signature. A: Most factors’ coefficients were penalized toward zero by LASSO regression. B: 22 variables were screened out with a minimal partial likelihood deviance. C: Patients’ survival status, ranking by their risk score. D: Survival analysis between high-risk and low-risk group. E: Risk score outweights common clinical features in predicting patients’ survival with higher AUC of 0.788. F,G: Univariate and multivariate Cox regression demonstrated the prognostic signature can be an independent prognostic factor. (AUC: Area under the curve; BMI: Body mass index).
Figure 4: Validation on ARID1A’s ability to predict patients’ survival outcome. A, B: Difference of immunotherapy response rate between high-risk and low-risk group, predicted by TIDE and ImmuneCellAI algorithms respectively. C: Alteration spectrum of 9 mutant and 4 copy number varied genes screened above. D: Mutation sites of ARID1A in EC. E: There weren’t difference of ARID1A mRNA expression between ARID1A mutant and wild groups. F: ARID1A mutant group showed a better survival outcome in UCEC (Uterine Corpus Endometrial Carcinoma) cohort. (ns: not significant; response & non-response: patient response to immunotherapy or vice versa; ARID1A-mut & ARID1A-wild: group with ARID1A mutation or vise versa).
Figure 5: Effect of ARID1A mutation on MSI (Microsatellite instability), 8 immune checkpoints and 26 immune cells in EC (endometrial carcinoma). A: ARID1A mutant group showed higher proportion of MSI-H than wild group in EC. B: ARID1A mutant group displayed higher level of PDCD1, LAG3 and TIGIT than wild group in EC. C: ARID1A mutant group exhibited higher infiltration of CD8+ T cell than wild group in EC. (MSI-H: Microsatellite-instabilityhigh; MSS: Microsatellite stability; *: P< 0.05; **: P< 0.01; ***: P< 0.001).
Declarations
Ethics approval and consent to participate
As all datasets involved in this study were from public databases, ethics approval is not required.
Consent for publication
All authors approved the submission and the International Committee of Medical Journal Editors (ICMJE) criteria for authorship was met.
Availability of data and material
This study was based on secondary databases which are publicly available in TCGA(https://xenabrowser.net/ datapages/), Cbioportal (www.cbioportal.org) and OncoKB database (http://oncokb.org), without identification of individual data.
Competing interests
Author Jiantong Zheng was employed by the company Shenzhen Dymind Biotechnology Company Limited. The remaining authors declare that the research was conducted without any relationship that could be construed as a potential conflict of interest.
Funding
The study was supported in part by the National Natural Science Foundation of China (81801517 to L.X.F.), Shenzhen Project of Science and Technology (Grant No. JCYJ20190809094407602) to L.X.F, Medjaden Academy & Research Foundation for Young Scientists (Grant No. MJR20190009) to L.X.F and the fund of “San-ming” Project of Medicine in Shenzhen (No.SZSM201812088).
Authors’ contributions
Xiaofeng Li: Conceptualization, Original draft preparation
Qiu Wang: Methodology, Visualization
Jiantong Zheng: Data curation, Software
Abraham Jia:Conceptualization, Methodology, Software
Xiuqing Liu:Conceptualization, Original draft preparation
Figure 6: ARID1A mutation may interact with Treg and promote Type-I-IFN-Response pathway to facilitate tumor immune response in EC (Endometrial Cancer). A: 71 DEGs (differentially expressed genes), 25 up-regulated and 46 down-regulated, between ARID1A mutant and wild group in UCEC (Uterine Corpus Endometrial Carcinoma) cohort. B: KEGG and GO enrichment analysis of the 71 DEGs. C, D: correlation between 25 up-regulated genes/ 46 down-regulated genes and abundances of 26 immune cells respectively. E: Regulating network between immune pathways (purple), tumor infiltrating cells (red) and DEGs (green). (UCEC: The Cancer Genome Atlas-Uterine Corpus Endometrial Carcinoma cohort; FDR: False Discovery Rate; KEGG: Kyoto Encyclopedia of Genes and Genomes; GO: Gene Ontology).
Ling Ji:Conceptualization, Reviewing and Editing
Xiaofeng Li and Xiuqing Liucontributed equally to this study.
Acknowledgement
We acknowledge and thank all participants contributing to this study, especially Prof. Ling Ji for her kind advice and support. We also acknowledge TCGA and Cbioportal for their effort on these public datasets.
Felix A, Scott McMeekin D, Mutch D, Walker JL, Creasman WT, et al. (2015) Associations between etiologic factors and mortality after endometrial cancer diagnosis: the NRG Oncology/Gynecologic Oncology Group 210 trial. Gynecol Oncol 139: 70-76. [ Ref ]
Makker V, Rasco D, Vogelzang NJ, Brose MS, Cohn AL, et al. (2019) Lenvatinib plus pembrolizumab in patients with advanced endometrial cancer: an interim analysis of a multicentre, open-label, single-arm, phase 2 trial. Lancet Oncol 20: 711-718. [ Ref ]
Rubinstein MM, Caird I, Zhou Q, Iasonos A, Friedman CF, et al. (2019) A phase II trial of durvalumab with or without tremelimumab in patients with persistent or recurrent endometrial carcinoma and endometrial carcinosarcoma. Journal of Clinical Oncology 37: 5582-5582. [ Ref ]
Chen Y, Li Y, Guan Y, Huang Y, Lin J, et al. (2020) Prevalence of PRKDC mutations and association with response to immune checkpoint inhibitors in solid tumors. Mol Oncol 14: 2096-2110. [ Ref ]
Ghoneim H, Fan Y, Moustaki A, Abdelsamed HA, Dash P, et al. (2017) De Novo Epigenetic Programs Inhibit PD-1 Blockade-Mediated T Cell Rejuvenation 170: 142-57.e19. [ Ref ]
Robinson M, McCarthy D, Smyth G (2010) edgeR: a Bioconductor package for differential expression analysis of digital gene expression data. Bioinformatics (Oxford, England) 26: 139-140. [ Ref ]
Tian Y, Morris TJ, Webster AP, Yang Z, Beck S, et al. (2017) ChAMP: updated methylation analysis pipeline for Illumina BeadChips. Bioinformatics (Oxford, England) 33: 3982-3984. [ Ref ]
Jiang P, Gu S, Pan D, Fu J, Sahu A, et al. (2018) Signatures of T cell dysfunction and exclusion predict cancer immunotherapy response. Nature medicine 24: 1550-1558. [ Ref ]
Miao Y-R, Zhang Q, Lei Q, Luo M, Xie G, et al. (2020) ImmuCellAI: A Unique Method for Comprehensive T-Cell Subsets Abundance Prediction and its Application in Cancer Immunotherapy. Adv Sci 7: 1902880. [ Ref ]
- He Y, Jiang Z, Chen C, Wang X (2018) Classification of triple-negative breast cancers based on Immunogenomic profiling. Journal of experimental & clinical cancer research 29: 327.
Hänzelmann S, Castelo R, Guinney J (2013) GSVA: gene set variation analysis for microarray and RNA-seq data. BMC Bioinformatics 14: 7. [ Ref ]
Okamura R, Kato S, Lee S, Jimenez RE, Sicklick JK, et al. (2020) ARID1A alterations function as a biomarker for longer progression-free survival after anti-PD-1/PD-L1 immunotherapy. J Immunother Cancer 8: e000438. [ Ref ]
Li J, Wang W, Zhang Y, Cieślik M, Guo J, et al. (2020) Epigenetic driver mutations in ARID1A shape cancer immune phenotype and immunotherapy 130: 2712-2726. [ Ref ]
Jiang T, Chen X, Su C, Ren S, Zhou C (2020) Pan-cancer analysis of ARID1A Alterations as Biomarkers for Immunotherapy Outcomes. J Cancer 11: 776-780. [ Ref ]
Finn RD, Coggill P, Eberhardt RY, Eddy SR, Mistry J, et al. (2016) The Pfam protein families database: towards a more sustainable future. Nucleic Acids Res 44: D279-D285. [ Ref ]
Wilson MR, Reske JJ, Holladay J, Wilber GE, Rhodes M, et al. (2019) ARID1A and PI3-kinase pathway mutations in the endometrium drive epithelial transdifferentiation and collective invasion. Nat Commun 10: 3554. [ Ref ]
Jung U, Min K, Kim D, Kwon M, Park H, et al. (2021) Suppression of ARID1A associated with decreased CD8 T cells improves cell survival of ovarian clear cell carcinoma. J Gynecol Oncol 32: e3. [ Ref ]
Bala P, Singh A, Kavadipula P, Kotapalli V, Sabarinathan R, et al. (2021) Exome sequencing identifies ARID2 as a novel tumor suppressor in early-onset sporadic rectal cancer 40: 863-874. [ Ref ]
Wu R, Wang T, Shih IJCb, therapy (2014) The emerging roles of ARID1A in tumor suppression. Cancer Biol Ther 15: 655-664. [ Ref ]
Shen J, Ju Z, Zhao W, Wang L, Peng Y, et al. (2018) ARID1A deficiency promotes mutability and potentiates therapeutic antitumor immunity unleashed by immune checkpoint blockade 24: 556-562. [ Ref ]
Hugo W, Zaretsky JM, Sun L, Song C, Moreno BH, et al. (2016) Genomic and Transcriptomic Features of Response to Anti-PD-1 Therapy in Metastatic Melanoma. Cell 165: 35-44. [ Ref ]
Van Allen EM, Miao D, Schilling B, Shukla SA, Blank C, et al. (2015) Genomic correlates of response to CTLA-4 blockade in metastatic melanoma. Science (New York, NY 350: 207-211. [ Ref ]
Li L, Li M, Jiang Z, Wang X (2019) ARID1A Mutations Are Associated with Increased Immune Activity in Gastrointestinal Cancer. Cells 8. [ Ref ]
Dorta-Estremera S, Hegde V, Slay R, Sun R, Yanamandra AV, et al. (2019) Targeting interferon signaling and CTLA-4 enhance the therapeutic efficacy of anti-PD-1 immunotherapy in preclinical model of HPV oral cancer 7: 252. [ Ref ]
Patel S, Sanjana N, Kishton R, Eidizadeh A, Vodnala KS, et al. (2017) Identification of essential genes for cancer immunotherapy. Nature 548: 537-542. [ Ref ]
Tokunaga R, Xiu J, Goldberg R, Philip PA, Seeber A, et al. (2020) The impact of ARID1A mutation on molecular characteristics in colorectal cancer. Eur J Cancer 140: 119-129. [ Ref ]
Kim Y, Ahn J, Bae W, Sung C, Lee DJIjoc (2019) Functional loss of ARID1A is tightly associated with high PD-L1 expression in gastric cancer. Int J Cancer 145: 916-926. [ Ref ]
Hu G, Tu W, Yang L, Peng G, Yang L (2020) ARID1A deficiency and immune checkpoint blockade therapy: From mechanisms to clinical application. Cancer Lett 473: 148-155. [ Ref ]
