Journal Name: Journal of Biomedical Research and Reviews
Article Type: Research
Received date: 23 November, 2018
Accepted date: 27 December, 2018
Published date: 2021-03-21
Citation: Yehene E, Fuerst O, Domingues A, Paiva T (2019) Mobile Based Quantitative Measure of Stress. J Biomed Res Rev Vol: 2, Issu: 1 (27-33).
Copyright: © 2019 Yehene E. This is an open-access article distributed under the terms of the Creative Commons Attribution License, which permits unrestricted use, distribution, and reproduction in any medium, provided the original author and source are credited.
Abstract
Objective: The aim of the present study was to show the validity of a mobile based application (“Serenita”), as a tool for measuring stress level quantitatively. In this interactive app, the user places his finger on the mobile`s camera lens, through which information related to the user’s blood flow, heart rate, and heart rate variability (HRV) is extracted. Physiological signals are then being filtered and processed through a certain machine- algorithm, resulting in a quantitative estimation of the user’s stress level.
Method: a mixed sex group of 50 volunteers were recruited to participate in a standardized laboratory experiment, where a psychosocial stress protocol (Trier Social Stress Test-TSST) was implemented. Throughout the course of the experiment, physiological stress response was measured using both salivary cortisol level and Serenita app, hence, using a within subject design.
Results: Serenita algorithm was able to effectively detect changes in the participant`s estimated stress level, as expected by the different experimental conditions and followed the robust physiological response pattern usually obtained by the TSST protocol. In addition, a cross correlation of .93 was obtained between the estimated stress level, using Serenita`s algorithm, and Cortisol level measures.
Conclusion: these results serve a double validation for Serenita as an effective tool to quantitatively measure physiological stress response. This innovative technique bears important implications for the field of stress research and treatment, providing to the best of our knowledge the first clinically validated non-lab based quantitative physiological stress measurement tool.
Keywords
Stress, Cortisol, Trier Social Stress Test-TSST, Mobileapplication, Digital-health, Stress- measurement.
Introduction
It was already noted that “Stress” has been described as the “Health Epidemic of the 21st Century” by the World Health Organization [1,2], and up to date is even estimated to cost American businesses up to $300 billion a year. For instance, in a recent USA study, over 50% of individuals felt that stress negatively impacted work productivity [1]. But stress is present in almost every other aspect of our life and may cause hypertension, obesity, addiction, anxiety, depression and diabetes and heart attack, hence detrimentally impacting our emotional equilibrium and physical health [3,4].
Up to date, psychological assessments tools for stress, focus on the perceived stress that an individual report across different life domains [5,6], while others attempts at identifying triggers associated with the activation and the elevation of stress level [7,8]. Being primarily self-report questionnaires, these tools are limited in nature, as they measure stress indirectly mostly through the subjective perception of the individual, hence, susceptible to several biases [9]. On the contrary, biological tools, such as elevated levels of the `stress hormone` Cortisol, which bypass these shortcomings, focus primarily on measuring the direct and objective physiological derivatives of the activated HPA axis and the sympathetic nervous system [10]. However, as these valid parameters are extracted from lab tests, their utilization as practical and feasible tools for clinical evaluation and research purposes remains problematic.
Thus, despite the known adverse impact of stress on our well-being, there is still no acceptable clinical tool to measure stress that is both objectives, accessible and clinically validated. The creation of such a tool seems essential especially if it could be utilized for the amelioration of stress epidemic. This is the first of such attempts.
The current study
As modern life imposed a very hectic life style, the need for immediate and proficient digital solutions to maintain wellbeing arise. This trend is indicated by the growing number of developments in the field of `digital health’. Serenita i s an interactive relaxation mobile based application designed to monitor and control stress levels. The application incorporates two major features: diagnostic and therapeutic. As an assessment tool Serenita estimates the user`s stress level by reading physiological parameters and generating a quantitative real-time stress result. As therapeutic tool it provides the user with a set of personalized breathing exercise aimed at reducing the obtained stress level. A recent study has shown that Serenita could be used to effectively reduce blood sugar level with Type II patients [11].
The current study was designed to validate and fine-tune the algorithms supporting the stress estimation function in this mobile application, under a clinical setting. In order to validate Serenita as an adequate stress estimator it was necessary to build a standardized experimental protocol able to i) effectively induce stress on a set of volunteers, ii) and properly quantify the stress variation. To this end, we adopted the Trier Social Stress Test (TSST – [12]) as this well documented laboratory procedure, was shown to reliably induce stress in human research participants and used extensively in the field of stress studies [13,14]. The efficiency of TSST as a stress inducer, was explored not only through properly calibrated questionnaires but also with the analysis of the Cortisol, as physiological stress indicator, which is extensively used in clinical setting to determine stress levels and the response to stressful events. Similarly, the current study followed the typical experimental protocol. However, its novelty lies in combining traditional as solid stress inducer (TSST) and indicator (saliva cortisol), with an innovative digital-health assessment tool (Serenita application). Utilizing both tools to measure physiological stress in the course of the experiment, will not only comply with our research goal of establishing reliability and validity, but also will neutralize any potential variability in stress response that might be stemming from sex differences [15,16].
Materials and Methods
Participants
Volunteers for the study were recruited through an online application form. In order to avoid biases during the recruitment process and data acquisition stage, the study received the title: “Algorithms for Heart Rate Variability Analysis during daily activities” and was presented to the volunteers as a study with the objective of validating such algorithms, i.e. no references to stress were made until the end of the experiment. Approximately 70 people applied online to participate on the study. Participants undergoing stimulating or anti-depressive medication or suffering from cardiovascular, endocrine, neurological disorders, were not admitted.
As part of the recruitment process the volunteers filled a Depression Anxiety Stress Scale (DASS)-21 form, used to identify and exclude subjects suffering of depression, anxiety and high levels of tension/stress (see below). No volunteers were discarded due to the DASS-21 result or their reported values of the blood pressure. However, in order to keep the age groups balanced, 20 younger volunteers were discarded. Thus, a total of 50 volunteers were invited to the lab to participate in the experiment. The average age of the final sample was 33.7 ± 11.9 years old, comprised of 27 female and 23 male volunteers. Table 1 shows the distribution of volunteers by gender and age group.
Table 1: Distribution of volunteers by gender and age group.
| Age Group | Gender | No. of Volunteers |
|---|---|---|
| 18-24 | F | 6 |
| M | 5 | |
| 25-34 | F | 8 |
| M | 6 | |
| 35-44 | F | 4 |
| M | 5 | |
| 45-54 | F | 4 |
| M | 4 | |
| 55-56 | F | 5 |
| M | 3 | |
| Total | 50 |
Study design
After the initial on-line filtering, the approved volunteers were invited to select a participation date and schedule. The study was performed at Electroencephalography and clinical neurophysiology center (CENC), Lisbon, Portugal by a team of trained psychologists. The study was conducted in accordance with the Declaration of Helsinki, and the protocol and the conduct were approved by the Ethics committee of the CENTRO ACADEMICO DE MEDICINA DE LISBOA. On the day of the experiment, participants were not allowed to smoke, drink coffee or any stimulating drink, one hour before their enrollment in the study. Upon their arrival to the clinic, all participants received verbal and written information about the study and signed an informed consent at the beginning of the experimental session. Each session lasted between 2.0 hr.– 2.5 hr. and upon completion, all volunteers received a monetary compensation for their participation.
Materials
Online-baseline exclusion questionnaire: Depression, Anxiety & Stress Scale (DASS-21) [17], is a short form of DASS which is a self-report 4-point Likert scale and composed of three subscales: Depression (DASS-D), Anxiety (DASS-A), and Stress (DASS-S). The DASS-21 measures each of the three mental health conditions, over the past week, through seven items. Responses on each item range was from 0 (did not apply to me at all) to 3 (applied to me very much). The intensity of any of the three conditions is determined by the sum scores of responses to its 7-item subscale. The alpha reliability coefficients for the DASS–21 subscales have been examined in clinical and nonclinical samples and reported as .94 for DASS-D, .87 for DASS-A, and .91 for DASS-S [18].
Stress condition: The study protocol was a direct adaptation of the Trier Social Stress Test [12], consisting on the following steps:
- 0 Min. - Reception of the volunteer. The participant is asked to sit comfortably on the waiting room and given a series of neutral content magazines to consult during the waiting period. Saliva sample number 1 is acquired.
- 30 Min. - Saliva sample number 2 is acquired. The volunteer than is taken to the acquisition room.
- 35 Min. - The technician in charge for the data acquisition presents himself and prepares the data acquisition including PPG (which was taken several times throughout the experiment). Two cameras are placed in the room facing the volunteer.
- 45 Min. - Two fake “doctors” wearing lab-coats enter the room and read the following text without allowing the volunteers to interrupt or asking questions: “This phase of the task is a speech preparation. You will prepare a 5-minute speech where you describe the reasons why you would be a perfect candidate for your dream job. Your speech will be recorded and analyzed by a panel of experts on public speaking. You have 10 minutes to prepare your speech and your time starts now”. The “doctors” leave the room.
- 55 Min. - The “doctors” return to the room, turn the video cameras on and read the following text: “This phase of the task is the speech. You will describe the reasons why you would be the perfect candidate for your dream job. You will speak during the entire 5 minutes and your time starts now”. After the speech starts, the volunteer is allowed to have silent periods of no more than 20 seconds, after which the “doctors” say: “You still have time available, no questions are allowed”.
- 60 Min. - The “doctors” read the following text: “This is the mental calculus task. during the next 5 minutes you will be asked to sequentially subtract 13 from the number 1022. You will say your answers out loud and start again from 1022 after each mistake. Your time starts now”. After each mistake, the following text is read: “That is incorrect, please start from 1022”.
- 65 Min. – Saliva sample number 3 is acquired. The volunteer is taken back to the waiting room where he is asked to sit comfortably and relax. The aim of the study is explained in detail to the volunteer.
- 85 Min. - Saliva number 4 is acquired.
- 105 Min. - Saliva number 5 is acquired.
Stress measurement
Salivary cortisol: Cortisol, the circadian steroid hormone released in response to stress and low blood-glucose concentration [19], was used as the traditional physiological stress indicator. Following the experimental protocol, several samples of salivary cortisol were taken from each participant for the purpose of analyzing and measuring stress response. Data was recorded for each participant.
Mobile based app algorithm - Serenita
The stress estimation algorithm is based on the real-time acquisition of a photoplethysmography (PPG) signal from the mobile phone’s camera lens, where the user places his finger. Information related to the user’s blood flow, heart rate, and several heart rate variability (HRV) parameters is extracted. These signals are then filtered and processed using a large array of algorithms and machine learning to assess the user’s physiological stress level. HRV can be generally described as the natural variation of the instantaneous heart rate, induced by the regulatory mechanisms of the Autonomic Nervous System (ANS). Through adequate signal processing techniques, HRV can thus be regarded as an indirect measurement of the activity of the two branches of the ANS, sympathetic and parasympathetic, which is closely related with states of stress and relaxation respectively. Serenita uses a combination of HRV, HR, and breathing pattern parameters together with subject’s information such as age and gender as the inputs of a proprietary stress function that returns a quantitative estimation of the current stress level.
Results
The data of 50 participants resulted in the same number of valid datasets for analysis. The experimental methodology incorporated a within – subject design, where the variation of the stress level was estimated on two major stress indicators for each participant. Thus, each participant, had several measurements of salivary cortisol levels taken throughout the experiment alongside the physiological processed data of the Plethysmography (PPG), using Eco-fusion’s proprietary algorithms.
Data processing
The acquired PPG was processed using a workflow roughly composed by i) an outlier detection and removal, ii) a filtering step, iii) a peak detector, after which the instantaneous heart rate signal, commonly known as R-to-R signal (RR), is built. Several time and frequency features are then extracted from the RR signal, consistent with the standards defined by Task Force of the European Society of Cardiology and The North American Society of Pacing and Electrophysiology (1996) [20].
Several markers were included in all datasets during the acquisition phase, allowing the processed data to be divided into 4 distinct segments i) Baseline, ii) Interview Preparation, iii) Interview and iv) Arithmetic. Figure 1 shows the raw PPG signal, and the RR signal obtained after PPG processing and from which the HRV features are extracted for one volunteer.
Figure 1: Example dataset for one subject, showing i) the raw PPG signal, ii) the RR signal built from the PPG data, during the 4 different phases of the TSST protocol.
Stress estimation using Serenita
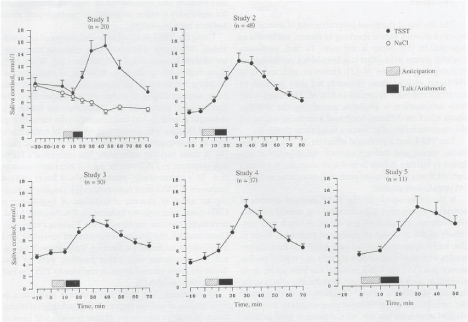
The TSST has been validated by several authors as a valid stress inducer protocol, by monitoring cortisol levels throughout the procedure. The typical curve of stress in response to a TSST is thus well defined (see Figure 2) and used as support for the current study. It is expected that stress level starts at a basal, or slightly increased level during the baseline period, increases during the interview preparation and peaks during the interview and/or during the arithmetic phase. Some individuals will show a strong response during the interview phase, recognizable as stress by trained psychologists, while others have a stronger response during the arithmetic phase. The combined effect of the clinical environment, cameras, doctors and social/ arithmetic challenges guarantee a stress response on all the individuals going through a TSST [21,22].
Figure 2: Typical salivary cortisol response to the TSST, adapted from (Kirschbaum et al., 1993).
Serenita’s stress estimation algorithm computes stress from a set of pre- defined HR, HRV and breathing patterns features, which are the inputs of a proprietary function that expresses stress as a quantitative measure. Each instantaneous stress value is in fact computed from a window of data, which should be at least 1.5 minutes long and ideally 5 minutes, in order for the model to capture all the slow oscillations on the heart rate variability. In order to keep a high temporal granularity, the following results were computed with the minimum window, 1.5 minutes.
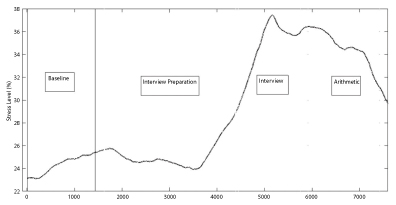
Figure 3 shows the stress response computed for one individual during the 4 stages of the TSST. as can be clearly seen, stress level using PPG signal, starts to increase around the middle of the interview preparation, having its maximum value shortly after the beginning of the interview. This figure shows the absolute value, in percentage of stress. This stress pattern which follows the expected stress pattern by the TSST protocol, can serve as a first validation for the reliability of Serenita as a valid assessment tool for measuring stress levels.
Figure 3: Stress response of one typical volunteer during the complete procedure.
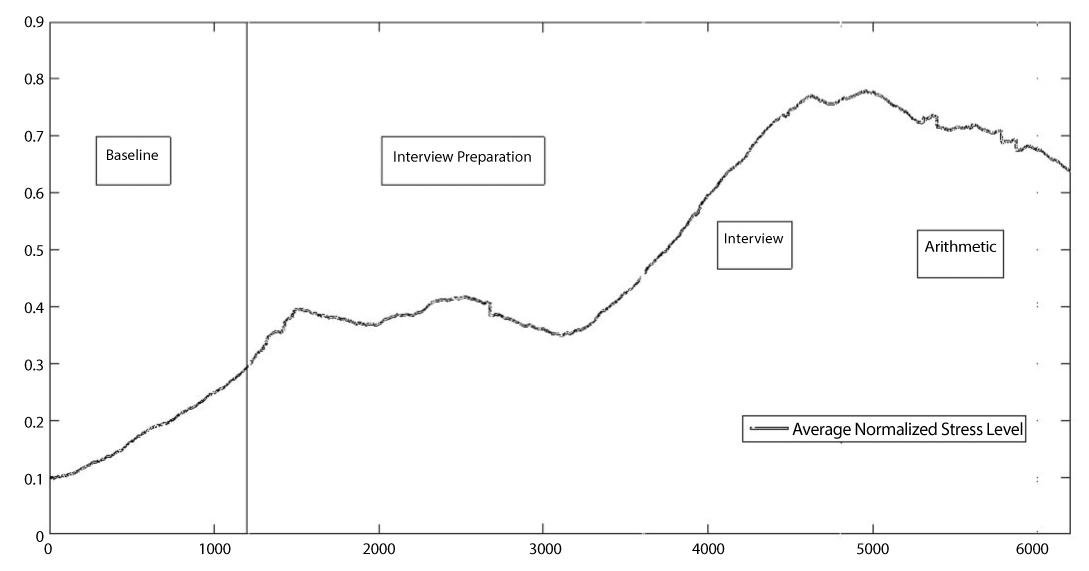
The direct comparison of the stress level for all individuals is not a trivial task, since the basal level and relative variation of stress will depend on each individual. In order to obtain an average response, all the stress responses were normalized, time aligned, and their mean computed. This average response, shown on Figure 4 is very similar to Figure 3, showing that the stress response follows a typical curve for every volunteer.
Figure 4: Average of the normalized stress response for all volunteers.
Table 2 shows that stress levels increase from Baseline to Interview Preparation, followed by a peak value during the Interview or Arithmetic stage. This is the typical response expected for a TSST. The variation percentage compares the average variation, in percentage, relative to the baseline period. The values shown on Figure 4 and Table 2 were computed from the 50 datasets.
Table 2: Average stress value (normalized) and average relative variation of stress during the 4 stages of the TSST.
| Phase | Baseline | Interview preparation | Interview | Arithmetic |
|---|---|---|---|---|
| Stress Value | 21.8% ± 21.3 | 46.6% ± 21.8 | 69.8% ± 20.0 | 69.49% ± 23.3 |
| Variation (%) | - | 6.9% ± 5.4 | 18.48% ± 11.8 | 17.7% ± 12.1 |
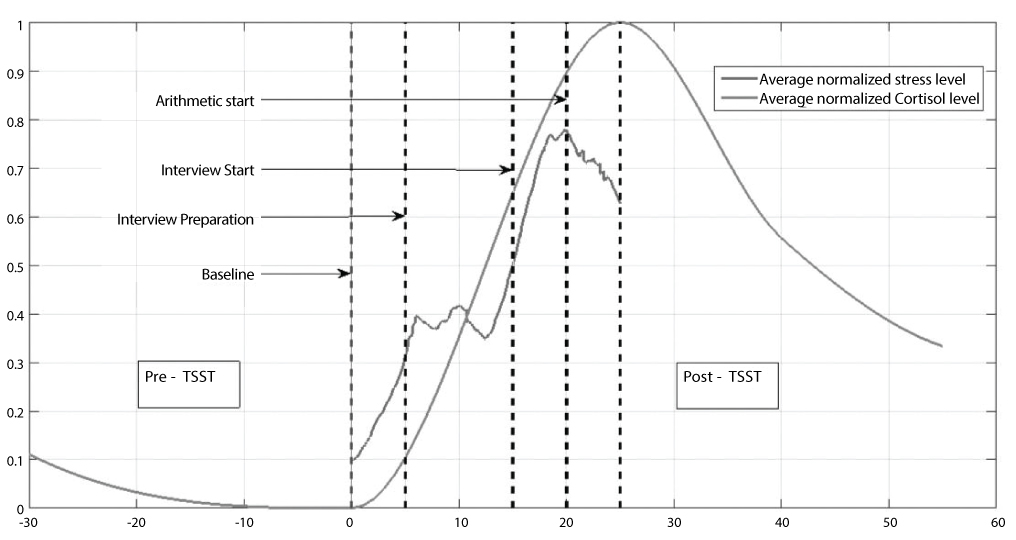
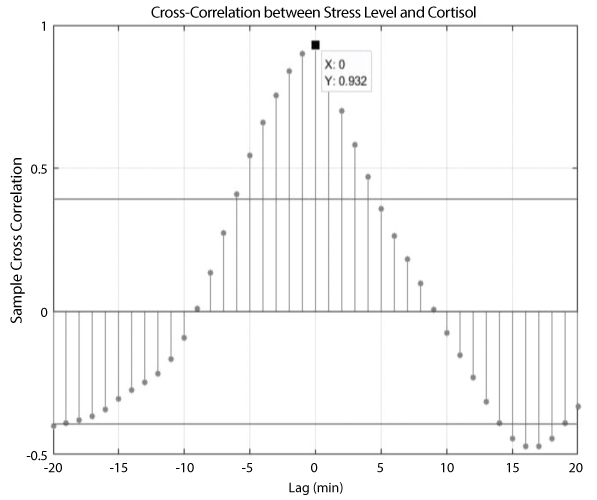
Figure 5 compares the average normalized stress level, computed using Serenita’s algorithm, with the average normalized cortisol value. The need to normalize cortisol levels is due to the fact that different individuals have distinct values of basal cortisol levels. The figure shows a high agreement rate between cortisol level and the estimated stress level. This fact is also supported by the data on figure 6 which shows the cross-correlation between average values of cortisol and stress level. The two signals have a maximum correlation of 0.93, which supports a high agreement between the two distinct measures of stress.
Figure 5: Comparison between the average normalized cortisol level and the average normalized stress level computed using Serenita’s algorithm.
Figure 6: Cross correlation between the estimated stress level, using Serenita’s algorithm, and Cortisol level.
Discussion and Conclusion
The present study aimed at investigating if the stress estimation algorithm, used by the Serenita app, was able to accurately estimate variations on stress levels. The TSST widely established as the standard protocol for stress induction was used to induce stress on a controlled clinical environment.
The estimated stress levels show a high agreement rate with the expected stress response of the TSST. Furthermore, the analysis of salivary cortisol levels provided an objective measure of the real variation on stress levels, the average cortisol curve has a correlation index of 0.93 with the estimated stress provided by Serenita’s stress algorithm, supporting the stress estimation algorithm as a feasible way to estimate stress.
Finally, in many stress monitoring applications it is useful to know, not just the relative change in stress along the time, but also to obtain a quantitative value for the stress level at any given time. Due to the highly subject-dependent nature of the basal level of stress (and cortisol) this task is relatively complex, however using a priori information such as age, gender, health condition, among others, it is possible to project the stress function into a bounded quantitative stress scale e.g. 0 − 100%.
As far as we know this is the first time where an application is providing a quantitative and validated method comparable to measuring stress with a lab test. This tool could serve as a research tool in stress studies.
Conflict of interest
Dr. Oren Fuerst and Dr. Alexandre Domingues are from Eco Fusion, the developer of Serenita. This study was sponsored by Eco Fusion.
There are no references

