Journal Name: Journal of Biomedical Research and Reviews
Article Type: Research
Received date: 01 November, 2018
Accepted date: 27 December, 2018
Published date: 2021-03-21
Citation: Fedoseyeva VB, Zharinova IA, Alexandrov AA (2019) Secondary Structure of Pre-mRNA Introns for Genes in the 15q11-12 Locus. Mapping of Functionally Significant Motifs for RNA-Binding Proteins and Nucleosome Positioning Signals. J Biomed Res Rev Vol: 2, Issu: 1 (01- 20).
Copyright: © 2019 Fedoseyeva VB. This is an open-access article distributed under the terms of the Creative Commons Attribution License, which permits unrestricted use, distribution, and reproduction in any medium, provided the original author and source are credited.
Abstract
In this study, we identified reproducible substructures in the folded structures of long intron RNAs for recursive spliced variants and annotated pre-mRNA for GABRB3 and GABRA5. We mapped the RNA motifs recognized by RNA-binding proteins for the specified locus and characterized the area of preferred localization. A comparison of premRNA variants revealed the dominant type of protein potential effects. We determined the structural specifics of RNA in the dense Alu cluster and clarified the analogy of apical substructure to the A-Xist fragment of transcriptional variant. Mapping of the nucleosome potential reveals alternation of strong and weak signals at the 3’-end portions of GABRB3 and clusters of nucleosome positioning signal in the vicinity of the Alu cluster. Distribution of simple oligonucleotides among reproducible substructures revealed an enrichment in Py-tracts; for some of them, this may be considered as a complementary supplement to the Putract enrichment of ncRNA Malat1 as a component of nuclear speckles. The secondary structure elements of bidirectional transcripts are predisposed for somatic homolog pairing in this locus, as was previously shown experimentally.
A model of potential intron RNA influence on splicing has been suggested based on its interaction with Py-tract-binding RNP, serinearginine SRSF proteins, ncRNA Malat1, as well as the action of Alu cluster.
Keywords
Pre-mRNA Introns, Genes, RNA-Binding Proteins.
Introduction
The splicing model for exons surrounded by long introns is based on the assumption of a pre-assembly of future spliceosome elements [1]. Splicing processes are assisted by components of other processes, such as transcription (RNA-Pol II CTD) and chromosomal activation [2-6], including the SAGA and SWI/SNF complexes [7-12]. A large fraction of introns spanning thousands of nucleotides participates in co-transcriptional splicing (coTS) without hindering splicing [13]; however, among them, there is a fraction (up to 20%) that may be subject to splicing at the post-transcriptional level (postTS) [14,15]. For example, the first long intron(s) is removed from pre-mRNA more slowly than the others [14] and thus is the first candidate for postTS. The role of the large introns themselves, at least of their main portion, remains poorly understood in the splicing process. Still, a separate facet of the interaction has long been known, namely, that the association between the nascent RNA and splicing factors in the nucleus is introndependent [16]. The significance of long introns is emphasized by the phenomenon of protecting long pre-mRNAs from premature cleavage and polyadenylation [17,18]. The role of long introns can be clarified by identifying the interaction of pre-mRNA (annotated as coding and/or in silico predicted RNA) with RNA-binding proteins and other RNAs, for example, non-coding RNA, pertaining to spliceosome pre-assembly. Non-coding RNA Malat1 is associated with recruitment of SR (serine-argenine) family pre-mRNA-splicing factors from nuclear speckles (NS) to the transcription sites [19]. In addition, it is also known that the splicing of exogenous pre-mRNAs occurs when they recruit the inter-chromosomal granular cluster (GC), e.g., serinearginine NS cluster [20, 21]. The composition of the granules includes SRSF1, SRSF2, U2snRNP proteins, MALAT1 and other components of the spliceosome. The peri-chromatin filament [PF] region containing the endogenous nascent RNA and associated proteins also can recruit GC granules [20-23], although the interaction of PF and GC is not always obvious [24,25]. Splicing strongly depends on the presence of pyrimidine tracts in RNA [20,26,27]; their removal leads to attenuation of splicing and granule binding. The role of pyrimidine tracts pertains not only to the nearest branch site but also to some cryptic sites.
This work aimed to identify the RNA features at protein binding sites in the case of one-and two-dimensional presentation. This involves determination of the RNA secondary structure in long introns. First, we focus on proteins involved in the composition of NS as well as the proteins interacting with pyrimidine oligomers. In addition, since according to the model, the nucleosome formation potential influences coTS, we elucidated the peculiarities of nucleosome and CTCF mapping at the DNA level because strong nucleosome signals and CTCF [28] may influence transcription pauses. The current work examined the DNA locus 15q11-13. The documented phenomenon of somatic pairing of homologous chromosomes was also included in our consideration as pairing disorders and emergence of diseases often occur simultaneously.
Features of the 15q11-13 locus
This locus encodes the α5, β3, and γ3 genes of GABAA receptor subunits. They do not belong to the group of mostcommon receptors subunit genes (α1,2, β1,2, γ1,2, etc.), but a wider range of structural and functional properties of α5(GABRA5) and β3(GABRB3) genes and their association with neurodegenerative diseases make them the most attractive for sequence analysis. The β3 gene is expressed not only in the brain but at lower levels in other tissues; as a part of locus, it participates in somatic homologue pairing in late S phase [29] in lymphocytes as well as in neuronal tissue and in in vitro systems [30,31]. The β3 gene is the shortest among β genes, although other in silico predicted bidirectional transcript variants as well as recursive splicing variants have been suggested in addition to experimentally annotated ones. The bi-directionality is supported by the presence of spliced and unspliced EST sequences in the antisense and sense versions. Elucidation of the structural and functional properties of the bi-directionally oriented Alu repeat cluster at the beginning of β3 gene is a separate problem, and despite the knowledge of multiple properties of this repeat type [32], the desirable completeness of information is not achieved, especially at the transcriptional level.
The multiple annotated variants of pre-mRNA and protein isoforms for the β3, α5 genes are significantly different in size and stages of expression (foetal and adult). Expression of a long variant 1,2 with a long intron at the beginning of the transcript (after the cassette exons) is associated in the brain with a foetal developmental stage, the intermediate length pre-mRNA (variant 3) is also expressed in brain and at lower levels in lungs, cardiomyocytes, and germinal cells [33]. The shortest pre-mRNA variant 4 (core-part) is expressed in adult brain. The β3 gene is of importance due to its association with the Angelman syndrome [34-38], with the Prader-Willi syndrome (multiple deletions of a significant middle portion of a long intron) [39], with epilepsy (point mutations), and autism [40]. GABRB3, GABRA5 are considered as candidate genes responsible for panic disorder [41].
Materials and Methods
We used the calculation of minimum free energy (MFE) and RNA folding by Markham and Zuker’s programme UNAFOLD [42]. Computations were supported by MS Windows (32-bit architecture), Linux (64-bit), Cluster/img. ras.ru/galaxy resource and MFOLD [43] for thermo-dynamic parameters determination, as well as by Microsoft Office, CorelDraw and Delphy7 for mapping of nucleotide motifs. For calculations of nucleosome positioning [NP] potential we used a previously written Turbo Pascal script [44]. For the primary sequences (Table S1) and annotated variants of pre-mRNA, in silico prediction by Genscan and Gene id programmes was done for promoters (annotated and hypothetical), EST, GC-rich regions, and Alu repeats using https://ncbi.nlm.nih.gov (GenBank) and https://genome. ucsc.edu as data sources.
Results and Discussion
This study is divided into several parts: (a) two folding methods for large intronic RNAs, (b) mapping of recognition sites for RNA-binding proteins at the primary nucleotide sequence level and at the level of secondary structures in intronic RNA, (c) evaluation of oligonucleotide occurrence close to the motifs recognized by RNA-binding proteins and their complementary counterparts, for the folded secondary structure branches (set of reproducing helix-loop structures) and intermediate fragments, (d) examination of RNA folding in the dense Alu cluster and A-Xist–like apical substructure associated with it, (e) the DNA level mapping of nucleosome potential (NP) and proposed transcriptional pauses associated with CTCF binding [28], and (f) analysis of communication between homologous chromosomes mediated by antisense and sense pre-mRNA with the aim of offering a possible mechanism to explain the initiation of pairing between homologous chromosomes.
Scheme of 15q11-12 locus
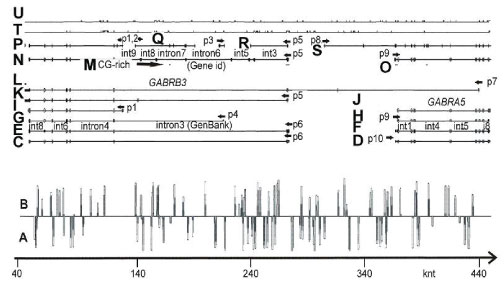
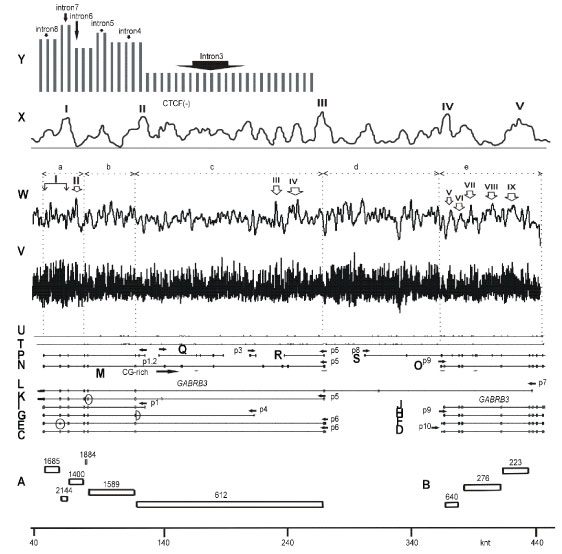
Figure 1A, B shows localization of the Alu repeats in two orientations; the clusters of them can be seen at the beginning (5’ end) of intron 3 (GenBank, GABRB3 gene) and at the end of intron 3. One can see experimentally identified transcript variants, corresponding to different protein isoforms for GABRB3 and GABRA5 genes (Figure 1C-L), the computationally predicted transcripts matching the experimental ones, sites of recursive splicing for long introns (Figure 1N-S), promoters, GC-rich region (Figure 1M,O) and EST including un-spliced for both orientations (hg38 assembly) (Figure 1T,U).
Figure 1: Scheme of GABRB3 and GABRA5 operon, annotated and in silico predicted transcription variants, EST and Alu repeats. (A), (B) – Alu repeat localization in the (+) and (-) orientation. (C) KJ534842, var2, adult brain. (D) L08485 (adult brain). (E) AK315311, var 2 (foetal brain). (F) BC113422 (brain and lung). (G) AK302822, var3 (brain, cardiomyocyte, lung, testis et al). (H) BC111979 (brain and lung). (I) AK295167, var4. (J) BC011403 (retinoblastoma). (K) BC010641, var1 (retinoblastoma). (L) CR749803 (retina). (M) GC-rich regions. (N-O) Gene id (-). (P) Genescan (-). (Q) Genescan (+). (R) Genescan(-). (S) Genescan (+). (T) EST (-). (U) EST (+). Start point (40 knt) corresponds to 26540 knt for chr15 (hg38 assembly). (C) - (L) Annotated human mRNA from GenBank. (N)-(O) in silico predicted mRNA by Genscan, Gene id programmes. Annotated promoters P1, P4- 6, 9, 10. (C) - (L) GenBank mRNA variants.
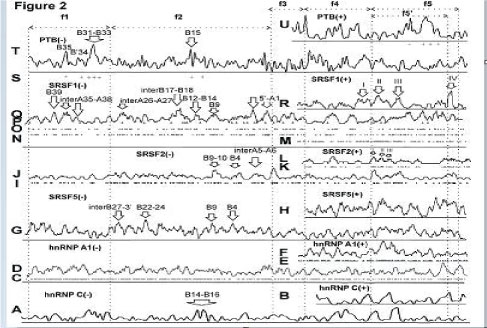
The mapping data for sites along the nucleotide sequence of locus 15q11-12 are shown in figure 2 for RNA-binding proteins: for serine–arginine SRSF1 (aliases ASF, SRp30a, SFRS1, SF2), SRSF2 (aliases SC35, SFRS2, SRp30b, SFRS2A), SRSF5 (aliases SFRS5, SRP40, HRS), hnRNP A, C and PTB proteins. The data are based on functional methods, immunoprecipitation and SELEX. Since GABRB3 and GABRA5 genes have different orientations, the mapping was carried out for the (+) strands and (–) strands in accordance with gene orientation.
Figure 2: Mapping of sites for RNA-binding proteins. (A) hnRNP C site (complement to 5T (-)) [45] after averaging. (B) hnRNP C binding site (motif 5T (+)) after averaging. (C) hnRNP A1 site (complement to TAGGGA/T (-)) [46]. (D). Averaged data from (C). (E) hnRNP A1 site (motif TAGGGA/T (+)). (F) Averaged data from (C). (G) SRSF5 site (complement to CDGCA (-)) [47]. (H) SRSF5 site (motif CDGCA (+)). (I) SRSF2 site (complement to AGGAGAT and GRYYCSYR (-)) [48, 49]. (J) Averaged data from (I). (K) SRSF2 site (motif AGGAGAT and GRYYCSYR (+)). (L) Averaged data from (K). (M) SRSF1 SRSASGA, RGAAGARR, RGAAGAAC sites (+). (N) SRSF1 sites (complement to SRSASGA (-)) [47]. (O) SRSF1 sites (complement to RGAAGARR(-)) [50]. (P) SRSF1 sites (complement to RGAAGAAC (-)) [51]. (Q) Averaged data from (NP). (R) Averaged data from (M). (S) PTB P motifs as in (T) incorporated in Py-rich tract (> 15 nt) for (-). (T) PTB P sites (complement to TTCT, TCTT, CTCTCT (-)) after averaging. (U) Motifs of PTB P sites (TTCT, TCTT, (C)TCTCT (+)) [52-54] after averaging. f1 fragment - core-part, f2 fragment – intron 3 (GenBank, GABRB3), f3 fragment – between P5 and P8 promoters, f3+f4 fragments – between GABRB3 and GABRA5 regions, f3+f4+f5’ fragment - two first introns for a long variant CR749803 (Figure 1L), f5 fragment - GABRA5 gene. (G) - (P) R-purine, Y-pyrimidine, S: G or C; D: A, G or U.
Two folding methods for large intronic RNAs
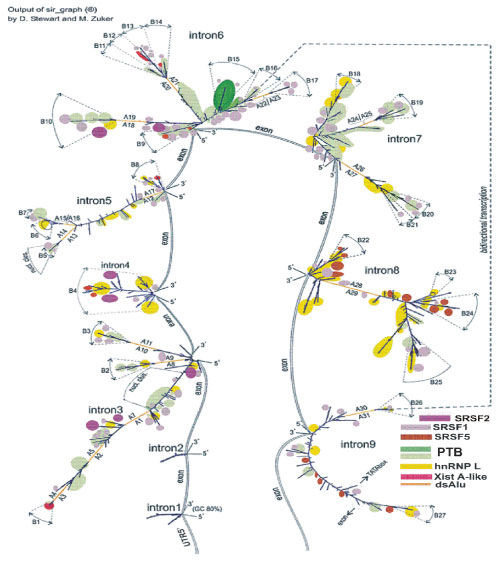
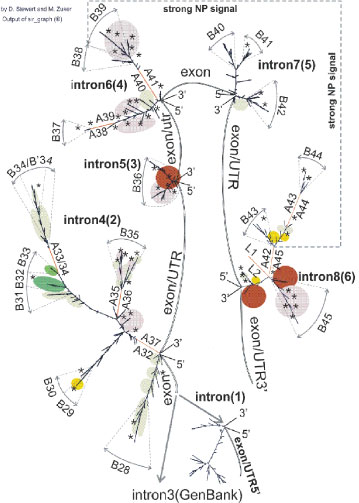
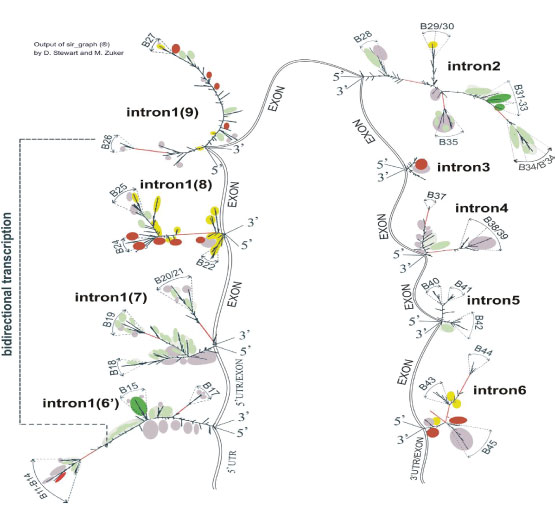
First, in accordance with in silico predicted splicing sites (Gene id programme), we subdivided the longest intron of pre-mRNA (149 knt) (Table S1) into smaller fragments. Their lengths allow acceptable time needed for computation of secondary structure folding of intronic RNAs. These fragments may be considered as corresponding to recursive splicing. Figure 3 depicts long intronic RNA of GABRB3 gene that together with a core-part (Figure 4) constitutes transcription variants 1,2. The core-part together with small exons/introns 1, 2 and 5’UTR corresponds to variant 4. Truncation of long 149-knt intron to 95 knt and joining it with the core-part gives rise to variant 3 (Figure 5). The lost fragment incorporates the Alu cluster with a presumably important function that leads to an enhancement of expression in some tissues. Variants 1, 2 (bivalence is due to an alternative splicing of starting exons) are expressed in brain at a foetal developmental stage, whereas variant 3 is largely expressed in adult brain and, to a lesser extent, in cardiomyocytes, lung, testis and in muscles [Proteomics, GenBank]. Variant 4 predominantly expresses in adult brain. Additionally, there is a very long transcript expressed in retina. According to the latest data, the locus transcription is bi-allelic in brain, and in disease, it is partially biased to mono-allelic variants [31]. In figure 3, the short constitutive introns are numbered 1 and 2, recursive intron numbering runs from number 3 to 9 (Gene id), and their entire combination corresponds to the constitutive intron number 3 (GenBank). The exons are presented schematically without showing their secondary structure. Alu repeats are indicated by letters A with the occurrence number in double-stranded state. Numbering by letter B marks the branches that may be considered as spatially separated substructures consisting of rows of alternating loops and helices. The folding images for intronic RNAs correspond to thermodynamically optimal structures, whereas the suboptimal ones have minimal differences and are not considered in the context of fragments of such length. The coordinates of structural elements relative to the genomic sequence are given in table S1 for the hg38 assembly of Homo sapiens genome (GenBank). These folding images are further used as the basis for mapping of RNA-binding proteins motifs.
Figure 3: Secondary structure of intron 3 (GenBank) transcripts (intron 3 – intron 9, Gene id) and intron 1,2 (GenBank). It is the basis for mapping of RNA-binding protein sites for the part of variant 1,2 of GABRB3 in the recursive splicing version. Assembly of intron 3 – intron 9 (Gene id) corresponds to intron 3_GenBank.
Figure 4: Secondary structure of intron transcripts as the basis for mapping of RNA-binding proteins sites (variant 4 (core-portion)). This variant also constitutes a part of variant 1,2 of GABRB3. Intron enumeration is done according to GenBank for variant 1,2 (enumeration for variant 4 is shown in parentheses). Colour spots are as in Figure 3.
Figure 5: Secondary structure of intron transcripts (GenBank) as the basis for mapping of RNA-binding protein sites (variant 3 of GABRB3). Enumeration of introns corresponds to constitutive splicing (GenBank), in parenthesis, correspondence to Gene id enumeration of long intron subdivision as in Figure 3, intron 1 (6’) is a truncated variant of intron 6 (Gene id, part of intron 3, GenBank). Colour spots indicate association with RNA-binding protein sites are as in Figure 3.
How do exons short compared to neighboring introns influence the shape of folding intron RNA in the absence of recursive splicing? Among the introns considered (from the intron3 _Gene id to the intron9_Gene_id), intron 8 underwent a significant change in form with a joint holding with a neighboring exon 9, the resulting form is shown in figure S2.
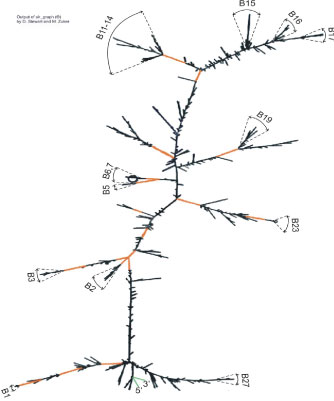
Second, the sliding window method was used for non-recursive folding variants, if such exist, to estimate the possibility of identification of folding peculiarities in long intronic RNAs, for example, intron 3 (GenBank, 149 knt) (Figure 6). This non-recursive folding may be realized at the early interphase when splicing is delayed compared with transcription. For each sliding window used for folding, in the resulting structure we distinguish the branches as clusters of concentrated helix-loop chains. Some of them are reproducible substructures when the length and position of the sliding window vary. Some of them coincide with the branches of the same coordinates for in silico predicted fragments (recursive variant) of the same intron (Figure 3). They are labeled with Bn as in previous description. The construction of the integral structure of the 149-knt intron (variant 3) is ambiguous due to the complexity and time required for calculation of the whole structure, but it is possible to link up randomly partitioned shorter nucleotide fragments (4-5 units) of reasonable length for minimization of total calculation time. After multiple attempts of composing, we selected those which have maximal numbers of reproducible branches. One of these potential variants (I-like, star-like and so on) is presented in figure 6 (I-like). Upon folding of long intronic RNA two processes are substantial: rebuilding of nascent RNA (annealing and re-annealing) and formation of slips. Due to the high AT-composition of introns, short double-stranded (ds) AT-rich fragments can re-anneal at room temperature [44], while longer or GC-rich fragments can be rearranged to a lesser degree. Fragments with dsAlu cluster can form a clip through annealing, which stabilizes the structure (with high thermodynamic preference), as seen in figure 3-7 marked in orange. Other possible types of clips are associated with protein binding and long complementary oligonucleotides. The presence of clips, as usually exhibited by dsAlu cluster, mainly determines the existence of reproducible substructures, such as some of Bn branches.
Figure 6: Example of secondary structure of intron transcript (intron 3_Gen- Bank) as a part of variant 1, 2 of GABRB3 (without recursive splicing).dsAlu is shown in orange, Bn - reproducible branches.
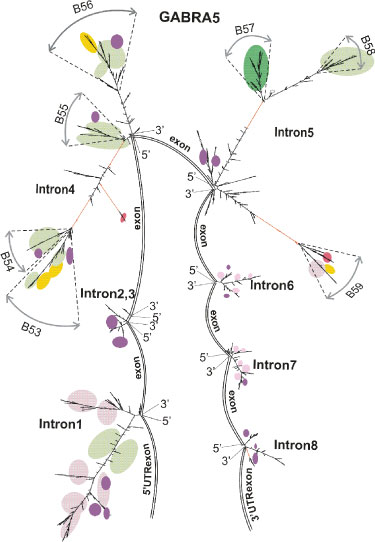
Figure 7: Secondary structures of intron transcripts (GenBank) as the basis for mapping of RNA-binding protein sites (transcriptional variants of GABRA5).
Mapping of protein binding sites
Serine-arginine protein family: We chose the serinearginine family proteins that are widely involved in intranuclear processes and have been relatively well-studied. SRSF1 protein (aliases ASR/SF2, SRp30a, SFRS1) may represent many functions: (a) an active participant of the spliceosome assembly [55-57]; (b) an exon enhancerbinding protein [58] in the case of double-site purineconsensus (which was not present in the locus) and as a splicing repressor at some locations, particularly in intron sequences [59-60]. The repression may be restricted only to some special situations, and consequently, the analogous sites fail to either activate or repress splicing intron localization in case of intron localization [61]. SR (serineargenine) proteins, including SRSF1 and SRSF2, are recruited to nascent pre-mRNA, as shown for polytene chromosomes and Balbiany Rings, in the gene-dependent manner and may even relocate during transcription to the more downstream parts of long genes [62,63]. This relocation predisposes them for transport to the cytosol and influences mRNA binding to the ribosome at further stages. Besides, the SRSF1 protein is a part of NS [64], and this participation may be phosphorylation-dependent, as it regulates alternative splicing [65]; beyond its roles in mRNA splicing, stability, and translation, this protein has other functions related to mRNA-independent processes, such as miRNA processing, protein sumoylation, and the nucleolar stress response [66].
For SRSF 1 proteins, following the data obtained by the functional UV cross-linking and immunoprecipitation (CLIP) method [49,67] and SELEX [50,51,68], we mapped potential sites for RNA binding on the locus sequence [Figure 2M-R]. The binding sites derived by the functional method (Figure 2N) had a consensus sequence SRSASGA (7-mer, S:G or C, R-purine) [49], which was more complicated by its nucleotide diversity than those derived on the basis of hepatitis delta virus genome sequence, which had a purine-rich consensus RGAAGARR (8-mer, R-purine) (Figure 2O) [50] or by the SELEX method (Figure 2P), which was represented by RGAAGAAC (8-mer, R-purine) [51]. Despite the differences in consensus, the overall numbers of combined binding sites are presented for completeness in figure 2Q for the (-) strand and figure 2M,R for the (+) strand.
Our mapping data are presented in two forms: mapping of binding sites (a) on the primary sequence of the locus in linear representation, and (b) on the secondary structure image (2D) of intron RNAs. Some branches, namely, B9, B12- 14, B39, and B45, are enriched in these sites. A much greater extent of enrichment has been found for the inter-branched spaces: 5’-A1, interA5-A7, inter B17-18, interB26-B27, inter B38-A41, interA35-A38, L2-5’ (Figure 2M-R, Figure 3-5,7, as violet spots for site density higher 1.5 motif/knt and as a star * in Figure 4) (GABRB3), whereas B42 and B44 are enriched to a lesser extent. For the longest pre-mRNA variant of GABRB3 (Figure 1L), significant peaks in the (-) strand are also present in the region intersecting with GABRA5 gene. In the case of 2*D mapping, the set of violet spots (Figure 3-5,7) coincides predominantly with intron 6,7 (Gene id, middle portion of intron 3, GenBank) as well as with the 5’end of intron 3 (GenBank) and indicates enrichment with SRSF 1-binding sites. It should be noted that exons are not highly enriched in SRSF1 binding sites; they are at the same average density level as introns. The density of binding sites for a long intron 3 (GenBank) is equal to 1.2 units/knt; for intron 4 (GenBank), it is approximately 0.4 units/knt; and the overall number of binding sites for intron 3 (GenBank, f2 fragment in Figure S1B, Figure 2T) is several times higher than the number of binding sites for the core portion of GABRB3 gene (f1 fragment, Figure S1B, Figure 2T). The introns 5, 6, 7, 8 (Gene id, part of intron 3, GenBank) (density ~1.21 units/knt) are more enriched in SRSF1-binding sites than intron 4 (GenBank). Introns 5-8 (GenBank, GABRB3, Figure 2Q, Figure 4) also have significant levels of SRSF1 binding sites.
For GABRA5 gene ((+) strand)) a strong peak I is located upstream of TSS (in silico predicted chr15.140.2 by Genscan), other strong peaks II, III are in intron 1, at the boundaries of introns 2,3 and in intron 6-8 (they alternate with peaks in the (-) strand). For intron 1 (GenBank, GABRA5) the density is equal to 1.74; for introns 4 and 5 (GenBank, GABRA5) it is equal to approximately 0.40 and 0.78 units/knt, respectively; for introns 6-8, it is equal to approximately 1.7 units/knt.
In other words, the beginning and the end portions of GABRA5 gene, as well as the middle and the 3’ end portions of GABRB3 gene, are enriched in SRSF1 recognition sites. Accumulation of recognition sites at the 3’ end portion of both genes may be useful for RNA processing in this portion, which has a high exon density.
Extended first introns with high total amounts of SRSF1 binding sites, as in the case of GABRB3 and GABRA5, because of the length and accessibility for scanning are more likely to reach the borders of the inter-chromosome GC, incorporating SRSF1 (important for spliceosome assembly) and SRSF2 for recruiting them or binding freely dispersed protein molecules, thus raising their local concentration the in gene vicinity, and therefore, first introns are prone to postTS. Intron 3 (GenBank, GABRB3) enrichment in SRSF1 recognition sites can serve as a storage device for an downstream area with densely located introns and exons in the case of postTS. Altogether, this can lead to an efficient processing of pre-mRNA.
According to the proteomics data (GeneBank) [69], the density of SRSF1 protein in brain is at a medium level (21.9 RPKM) (max level 44.79, min 4.4 RPKM), and the manifestation of function may be stronger in tissues with a higher level.
Another protein, SRSF2, from the same –serine-arginine family is believed to be present in NS (granules), involved in alternative splicing, appear in the differentiation of stem cells and play a role in transcription pause release in Drosophila and mouse, and, together with SRSF1, in mammals [70,71]. A disease-associated mutation in SRSF2 gene results in misregulated splicing by altering its RNA-binding affinities [72].
For the consensuses AGGAGAU and GRYYCSYR (Y-pyrimidine, R –purine, S:G or C) [47,48], explicit predominant localization of binding sites is not observed in the second and third portion of the longest intron 3 (Figure 2I,J). The mapping shows uniform binding character with the exception of the first third (near the 5’ end) of intron length. The GC-rich site in the promoter zone (GABRB3) has intermittent peaks I-IV of potential binding sites (Figure 2J, Figure 3, as dark violet spots for site density higher 4 motif/ knt). These peaks are also observed in introns 1, 4 of GABRA5 for the longest variant of GABRB3 ((-) strand) (Figure 2L). Analogous zones of intermittent peaks in introns 1 and 4 of GABRA5 gene for the (+) strand are represented by peaks I-III (Figure 2L). In the core portion of GABRB3 (variant 4) (Figure 2J ) and inter-gene portion between GABRB3 and GABRA5 (Figure 2J) the signals of potential binding sites are scarcely present. The peaks of potential SRSF2 potential binding sites are predominantly present in the downstream regions adjacent to 5’-ends of both genes, which may be associated with their role in the transcription pause release.
The gene expression according to Proteomics [69] (hppt://ncbi.nlm.nih.gov/gene) for brain is estimated as 30.1 RPKM, which is about the average level (max level 91.7 and min level 8.8 RPKM).
For SRSF5 protein (aliases SRp40, SFRS5), an important function is related to regulation of a significant factor switch through alternative splicing, and this is associated with a great variation in its concentration in utero during pregnancy [73]. The RNA recognition sites of SRSF5 protein are presented by ACDGS (D:A,G, or U,S:C,G) [49]. These sites are predominantly localized in the regions that are relatively free from other proteins. On a fairly uniform background (GABRB3) as a whole, the lateral zones, namely, intron 8 (Gene id, part of intron 3 (GenBank)) and, to some extent, intron 2 (Gene id, part of intron 3 (GenBank)), as well as intron 8 (GenBank) (second portion of core-gene) are enriched in SRSF5 protein-binding sites (Figure 2G, Figure 3-5, as brown spots for site density higher 10 motif/knt). For GABRA5, some strong peaks are present in introns 1,4,5 (GenBank) (Figure 2H, (+) strand), and in inter-gene region, binding sites are scarcely present.
For an easy description, we highlight fragment f1 as containing short introns, exons and 3’UTR, f2 - long intron, f3 – GABRB3 and GABRA5 inter-gene region, f4 - long intron of GABRB3 gene in accordance with the in silico predictions, and f5 – GABRA5 gene, f3+ f4 + f5’ intron transcription variant of GABRB3 gene (end-to-end across the GABRB3 and GABRA5 genes, active in retina). Quantitatively, the SRSF 1 signal density in f2 and f3+f4+f5’ for long introns (S1 Figure 1, S1) exceeds that for f1 (data for the gene-core), especially, when integrating over the entire length of GABRB3 gene, when it becomes obvious that the main share falls on long introns, as if they collect SRSF 1 protein molecules. The density values are approximately at the same level. The same situation is observed for SRSF 2, 5 proteins. Somewhat elevated levels of SRSF 1, 5-binding sites are present in the area adjacent to the 3’-ends of both genes. As follows from the data on potential RBP (RNA Binding Protein) binding sites determined by the primary nucleotide sequence for SRSF1, there is an excess of binding sites in relation to the number of exons for the gene (~25 times). In accordance with established view, the SRSF1 and SRSF2 proteins usually are attached to the motifs of single stranded RNA (open structure) [74-76]. For another protein RBP (PTB 1) it was found by experiments that the structuring of the RNA motif (partially open structure) leads to a twofold decrease in binding affinity [77]. Therefore, we made an attempt to evaluate the degree of involvement of binding sites in the local secondary structure of RBP identified by the primary sequence for subset of fragments with the most reproducible folding. We analyzed both thermodynamically optimal and suboptimal variants using MFOLD and UNAFOLD software and found out that the differences between the variants in evaluation of the ratio of the ds and ss states number of RBP binding sites are insignificant in the case of sufficiently long fragments. The occurrence of different structures of binding sites from fully closed (in ds state) to fully open (in ss state) varies widely. The average partial openness can be estimated at 45% (ratio of the number of nucleotides in ss states to the nucleotide number in primary binding site sequences), accordingly, the excess of the number of available binding sites in introns over the number of exons can be reduced. An accurate quantitative assessment is difficult due to the influence of possible thermal fluctuations on the openness and other nuances. It is important that partially open binding sites are likely to be weaker compared with fully open states and consequently the more reversibly binded by protein.
PTB protein binding
Other important poly-pyrimidine binding proteins PTB P1 and its paralog PTB P2 (expressed exclusively in brain and especially in neuronal precursor cells) are multi-functional proteins [78]. PTB P1 functionally mediates the formation of RNA loops [79] and also competes with U2AF for binding to Py-tracts (PPT) [80,81]. PTB P1 can influence alternative splicing and exon-skipping in certain cases (for example, exon skipping in GABRB2 gene in non-neuronal splicing extracts) [53,54,78], although the PTB P1 level in the brain, compared to other tissues, is sufficiently low (Proteomics data [69]). Its RRM1 (RNA recognition motif) binds to singlestranded RNA; while RRM1 and RPM2 remain independent in solution, RRM 3 and RPM4 may interact with each other producing a single globular protein moiety [83,84].
The RNA sequences for PTB binding contain 15–25 pyrimidine bases, with a preference for special pyrimidine tracts containing UCUU, UUCU, (C)UCUCU [52,53,85]. The occurrence of the UCUU/UUCU motif is significantly higher than of the (C)UCUCU motif, and as usual, the motif is colocalized with more nonspecific Py-tracts. We mapped these tracts along the 15q11-12 locus. In the long intron 3 (GenBank, GABRB3), they are localized in the central part in one-dimensional representation (Figure 2T) and in 2*D representation (Figure 3-5,7, green or dark green spots, green spots for tracts density higher 20 motif/knt, dark green ones for density higher 25 motif/knt), namely, in the strong peak B15 and in the weaker peak B11, as well as in inter-branch spaces inter(interB14-B15, interB15-B16). For the core-part of GABRB3 gene (Figure 4), such mapping revealed strong peaks В32-33, B34/B34’, B35. For a long intron 4, 5 of GABRA5 gene (GenBank), the peaks in onedimensional representation (Figure 2U) correspond to branches B55, B57, B58, also shown in 2*D representation (Figure 7). For chr15.140.2 intron of in silico predicted transcription variant, a strong peak of specific Py-motifs up-stream of the 5’-end of GABRA5 annotated transcripts was also mapped. For further elucidation of the degree of incorporation of specialized PTB-binding Py-motifs among nonspecific Py-fragments, we assessed the amount of 15-25 nt Py nonspecific fragments incorporating the specific Pymotifs. A large portion of specific PTB-binding Py-motifs is dispersed outside of continuous fragments containing 15-25 pyrimidines.
In the B11 branch, there is only one perfect Py fragment (>15 nt) with specific Py-motifs, in B15 - 1 Py-tract (>15 nt) with specific Py-motifs, in B31-33 – 4 tracts, in B34 - 8 Py tracts of 15-nt fragment, in B35 - 4 of 15 nt, in B55 - 1 of 15 nt, in B57 - 3 of 15 nt, in B58 - 1 tract longer than 15 nt with specific Py-motifs.
Green spots dominate the upper part of the picture (Figure 3), that is, in the centre of the long intron 3 (GenBank). In intron 4 (GenBank), the intensity of Py-rich motifs and tracts is higher than in intron 3 (GenBank) and is more concentrated. This increased level refers both to the overall number of motifs and to the number of almost fullsize fragments (>15 nt) enriched in specific Py-motifs. The level outside of this zone is quite low. A middle portion of GABRA5 gene (introns 4, 5) also contains strong peaks.
Pyrimidine tracts in introns of GABRB3 and GABRA5 genes are quite far away from the splicing sites in terms of their localization, so they are unlikely to affect exon skipping, and their role in the remote localization of splicing sites remains unclear. However, their influence on organization of long RNA loops by PTB P complexes with their repressor role in a weak and regulated exon splicing in a tissue and differentiation stage-dependent manner, which needs cofactors, cannot be excluded.
hnRNP
hnRNP L protein binds (CA)n, where n is approximately 30 and is localized at a certain distance from the 3’-splicing sites inside exons, where it serves as a splicing enhancer [86]. In most other cases, it serves as the silencer of splicing or an enhancer depending on its binding site proximity to the alternative 5’-splice site [87]. Not only regular CA repeats are recognized with high affinity, but so are certain CA-rich clusters. In our study, hnRNP L mapping was conducted in accordance with SELEX data [87] for regular CA repeats that are marked by yellow spots. Usually in single strand state. Long (CA)n repeats (n>30) are not encountered in the locus. Yellow spots in 2*D secondary structure image (Figure 3-5,7) correspond to oligomers, and their localization favours the silencing potential of splicing according to published data [87].
For hnRNP G binding sites, there is a preference for CCA repeats [88]. The B6 branch of the long intron 3 (Figure 3) has sufficiently long repetitions of similar sequence. As hnRNP G and hnRNP L binding sites may have some overlap, they are both labeled by yellow spots (Figure 3-5,7, as yellow sports for density higher 22 motif/knt). Note that hnRNP L,G proteins are present in the brain at the level below the average, compared to the spectrum of other tissues according to the Proteomics resource [69]. The CCA trinucleotide is a part of CCAT repeat, and both are encountered in B6. CCAT is the binding site of YY1 transcriptional factor that binds both DNA [89] and, with a lower specificity, RNA as well.
hnRNP A1 performs many roles. It is known that hnRNP A1 and SRSF1 compete with each other for implementation of alternative splicing [90]. hnRNP A1 also interacts with telomere sequences [91,92], associates with granules and accelerates annealing of single-stranded substrates [93]. The level of this protein in the tissues is high in accordance with many functions, whereas in the brain, it is below the average level. Mapping of hnRNP A1 high-affinity binding motif TAGGGA/T [46,89] shows many potential binding sites, dominating in the GC-areas, and outside of the long intron the binding sites are as frequent as in the long intron (Figure 2C-F).
hnRNP C is highly concentrated RNA-binding nuclear protein (in brain, approximately 48.8 RPKM, max 82, min 7.76 RPKM), it recognizes 5U and 4U [45]; however, not all potential binding sites are occupied, and upon mapping 5U tracts (Figure 2A, B), its plot approximately follows PTB P curves with some variations. We also mapped the hnRNP C binding site (5U) at the locus in 2*D representation and accomplished a computer simulation of the folding process by replacing 5T with 5N in order to take into account the effect of high nuclear density on the folding result. The comparison results relate to some changes in non-reproducing branches (data not shown). An influence of hnRNP C protein on the details of substructures requires separate consideration.
However, just now, as we evaluated the ratio of the number of nucleotides in the ss state and the total number of nucleotides in the motifs of hnRNP C binding sites (4U and 5U motifs in separated from each other variants) is 30%, which implies only partial availability of these motifs for protein binding. This compensates for the redundancy of the density of binding sites for hnRNP C compared to binding sites of SRSF1 and SRSF2. The long polyT sequences are as usually remotely located relative to the preferential localization of SRSF1 and SRSF2 proteins sites. The crowding of isolated from each other 4U is usually remote from SRSF1 and SRSF2 binding sites both by the primary sequence and by the secondary structure. The influence of hnRNP C on binding of SRSF1 and SRSF2 with intron RNA in the form of steric hindrance is not overwhelming at least in tissues with middle level of hnRNP C concentration.
Favouring the requirement of long intron protection from premature cleavage and polyadenylation [17-18], our results present the evidence of an increased density of polyadenylation signals for intron 3 (GenBank, GABRB3) (density of polyadenylation signals, 0.95 unit/knt) in comparison with the density for other introns (0.6 – 0.7 unit/knt). The maximum density of 27 is for A8 (Alu) in the polyadenylation site cluster. For GABRA5 gene introns, the density of polyadenylation signals is in the 0.4-0.5 unit/knt range, and for both genes, the first introns have maximal density level.
In addition, despite the high level of Drosha (RNase III) in the brain [69], it should be emphasized that the locus does not contain a Drosha pre-mRNA substrate for processing into miRNA. Additionally, this locus does not contain RESTbinding sites (REST is a transcriptional repressor of neuronal genes in non-neuronal tissues).
Enrichment of simple nucleotide tracts and its potential for branch interaction with ncRNA Malat1
Prevailing dispersed distribution of short (4-6 nt) Py-motifs recognized by PTB proteins prompted us to investigate oligonucleotides frequencies in this locus. We placed an emphasis on tetramers of simple nucleotide sequences, as they are the shortest simple sequences that are recognized by RNA-binding proteins, and they have an optimal length for complementation of single-stranded loops of secondary structure (kissing). More complicated by sequence composition and accordingly less-frequent tetramers encountered in AT-rich introns are too complex for simple analysis.
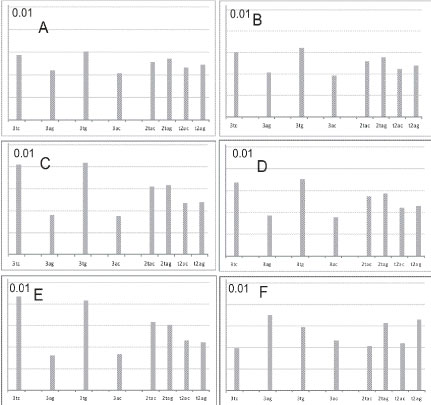
Proteins interacting with Py-tracts of RNA are presented by genes PTBP1, PTB P2, U2AF65 (U2AF2). Proteins having the shortest recognition motifs are represented by PTBP1, PTBP2. They require the UCUU/UUCU recognition motifs (PTBP1, PTBP2 binding sites), and elements of Py-tracts near branch point are recognized by U2AF65. To achieve the comprehension of the availability of different nucleotide tracts and their distribution within introns of GABRB3, GABRA5 genes, we present a preliminary assessment of tetramer occurrence based on nucleotide composition. We accomplished a rough frequency estimate without considering the Markov chain character of nucleotide sequences. According to figure 8, introns 5, 6 (Gene id), as parts of large intron 3 (GenBank, GABRB3), and intron 4 (GenBank, GABRB3) are mostly enriched in 3TC-tracts and 3TG-tracts, whereas introns 3, 4, 7, 9 (Gene id, parts of intron 3, GenBank)) are enriched in 3AC tracts (is not shown). More complicated 2TAC, 2ATC, 2TAG, 2ATG, AT2G and 2G2C tetramers are less representative in these introns, and we did not conside these tetramers with intron 3, 4, 7, 8, 9 (Gene id, parts of intron 3 (GenBank)), with their uniform representation of simple 3TC, 3AG, 3TG, 3TC tracts and more complicated 2TAC, 2ATC, 2TAG, 2ATG tetramers.
Figure 8: Occurrence of oligonucleotides in introns and Malat1 ncRNA. Intron 5 (Gene id, part of intron 3, GenBank, GABRB3). (B) Intron 6 (Gene id, part of intron 3, GenBank, GABRB3). (C) Intron 4 (GenBank, GABRB3). (D) intron 4 (GenBank, GABRA5). © intron 5 (GenBank, GABRA5). (F) ncRNA Malat1 ncRNA (EF177381).
Naturally, it is important to search for genomic elements containing Pu-tracts complementary to Py-tracts. These may be the local elements of the same introns as well as distant ones. The remote sequence of ncRNA Malat1 should also be included. According to microscopic studies mentioned earlier [20,27,94,95], the NS (granules) containing serinearginine proteins and Malat1 are recruited to the perichromatin fibril regions (PF), and Malat1 interacts with the nascent RNA [96]. Furthermore, pre-mRNA with Pytracts can recruit NS for implementation of splicing, and the recruitment and splicing process are realized only in the presence of Py-tracts [95]. Thus, we include ncRNA Malat1 as a component of granules in our oligonucleotide density consideration.
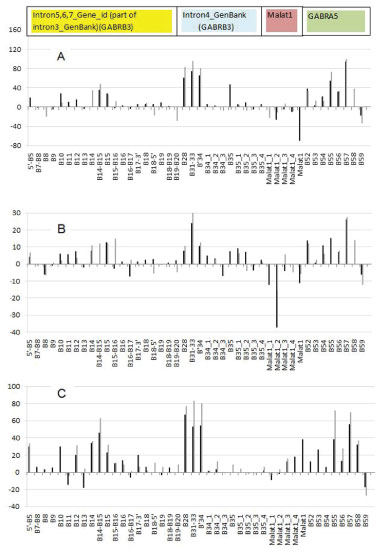
Within the abovementioned introns and according to the mapping results for 15q11-12 locus, we picked out for analysis the apical branches B9, B10, B11, inter B14-B15, B15, B16, B28, B31-33, B34, B35 (GABRB3) and B52-B59 elements (GABRA5). In figure 9A,B, the branches B11,B15,B31-33,B34,B35 and inter-branch fragments B14-B15, B15-B16 are the main carriers of Py tracts according to the density and overall number representation. In figure 9A,B, for branches, inter-branch fragments and branch sub-structures the overall count of tracts for the fulllength and density count per 1 knt of item length is equal to
Figure 9: Distribution of the difference between overall number or density for Py and Pu tetramers for some fragments of GABRB3 and GABRA5 gene introns. (A) (Py (3tc)-Pu (3ag)) difference (overall number of tetramers). (B) (Py (3tc)-Pu (3ag)) difference in density (overall number of tetramers per element length in knt). (A)-(B) TTCT/TCTT and AAGA/AGAA pair is in black, TTTC/CTTT and AAAG/GAAA pair is in gray. (C) (Py (3tg)-Pu (3ac)) difference in density. TTGT/TGTT and AACA/ACAA pair is in black, TTTG/GTTT and AAAC/CAAA pair is in gray.
count(Py) = number(TTCT) + number(TCTT) - number(TTCTT),
count(Pu) = number(AAGA) + number(AGAA) - number(AAGAA).
In figure 9A, the differences between count (Py)- count (Pu) for overall count of tract per fragment length are presented, as well as differences in their density per fragments length (Figure 9B). As follows from difference plot between Py and Pu, the branches B10, B14-B15, B15 (intron 3, GenBank, GABRB3) and especially B28, B31-B33, B34’, B35 (intron 4, GenBank, GABRB3) are enriched in dominating Py-tracts over Pu- tracts, the same applies to B52, B54-B58 (GABRA5), and on the contrary, Malat1 is enriched with Putracts versus Py-tracts, especially the Malat1-2 fragment. Analogous plots are depicted for pairs of CTTT/TTTC versus AAAG/GAAA tracts, as well as TTGT/TGTT versus AACA/ ACAA and GTTT/TTTG versus AAAC/CAAA. Analysis for the Py and Pu pairs (CTTT/TTTC and AAAG/GAAA) confirms the domination type deduced for the abovementioned Py (TCTT/ TTCT) and Pu (AGAA/ AAGA). For TTGT/TGTT and AACA/ ACAA tetramers, the difference plot (Figure 9C) reveals the domination of TTGT/TGTT over their counterpart AACA/ ACAA throughout most of the sequence collection (e.g., B9, B10 and so on, including Malat1), and this observation correlates with an active participation of UG-rich and UArich motifs in double-stranded stretches of the whole RNA folding structure, and in addition, it is an important for another discussion.
In more detail, for intron 6 (Gene id, part of intron 3, GenBank) the density of Py-tracts (TTCT/TCTT) is 13.4 units/knt versus 11 for Pu (AAGA/AGAA) tracts, for intron 4 (GenBank), the density of Py-tracts is 15.7 unit/knt versus 8.6 for Pu tracts. For example, for B15, the density of Pytracts is almost twice as high as for Pu-tracts, e.g., ρ(Py) ~ 15 units/knt, ρ(Pu) ~ 8 units/knt, (the highest concentration of Py in intron 3, GenBank), for B31-33, ρ(Py)~29, ρ(Pu)~5, B34 ρ(Py)~20, ρ(Pu)~10, B55 ρ(Py)~20, ρ(Pu)~5, B57 ρ(Py)~30, ρ(Pu)~4, B58 ρ(Py)~23, ρ(Pu)~5 unit/knt. The density in intron 4 (GenBank) is greater than that in intron 6 (Gene id) and in the entire intron 3 (GenBank). Also we determined that UUCU/ UCUU tetramers in B10, B11, inter B12-B15, B15, inter B15-B16, B16 are present at 50% in single strand (ss) state (in detail, for B15 near 35% are in ss state and ds state, and 30% are at the junction of ss and ds states); for B’34, approximately 43% are in ss state; for B55, about 45% of motifs are in ss state; for B57, about 58%; and for B58, approximately 56% are in ss state. These findings indicate that the ss state density for Py-tracts in intron 4 is greater than in intron 3 (GABRB3), and the highest Pyconcentration in ss state is inherent to B57, B58 (GABRA5). An opposite situation is observed for Malat1, where Pu-tracts dominate Py-tracts by more than 2-fols. An average density of Pu-tracts reaches 17 unit/knt, of Py-tracts, 8 units/knt for Malat1, and particularly in the middle part of Malat1-2 (Figure S3), the maximum density reaches 31-unit knt. In Malat1-2 fragment, AGAA/AAGA tetramers are present at 45% in a ss-state.
In the local interaction between ss of branch loops of Py and Pu types especially for interB14-B15, B15, B31-B33, B’34, B55, B57, B58, the equilibrium is significantly shifted to the prevalence of Py tracts, and local interaction between the branches/inter-branches is unlikely to lead to full compensation of the redundancy of Py-tracts, and conversely, for Malat1, the equilibrium is largely shifted to the prevalence of Pu- tracts. The coincidence of Pu-tetramer concentrations in Malat1 fragments and Py-tetramer concentrations in GABRB3 and GABRA5 highlighted the most significant fragments as well as ss-state portions. First, this means the ability to interact in complementary fashion at the nucleotide level through the mating loops, namely, the formation of tertiary structure elements between coding RNA and Malat1. For PTB proteins, the structural specificity of pyrimidine tracts was confirmed [77], suggesting that the preference refers to unstructured, ss strand variants in main motifs. Tracing the ss loops with Pu motifs of Malat1-2 often resembles a picture of the spatial repetition of ss loops for Py-rich branches of pre-mRNA. Second, the branches interaction of coding RNA Py-tracts with Malat1 Pu-tracts may be realized indirectly by the participation of proteins PTB P1,2 and/or U2AF65, and the influence of hnRNP C also cannot be excluded as well. The protein influence requires further investigation. This interaction may be realized in a tissue-dependent manner, as the concentrations of proteins vary significantly in tissues [69] (data of proteomics for each protein (http:// ncbi.nlm.nih.gov/gene)).
Cluster of Alu repeats’
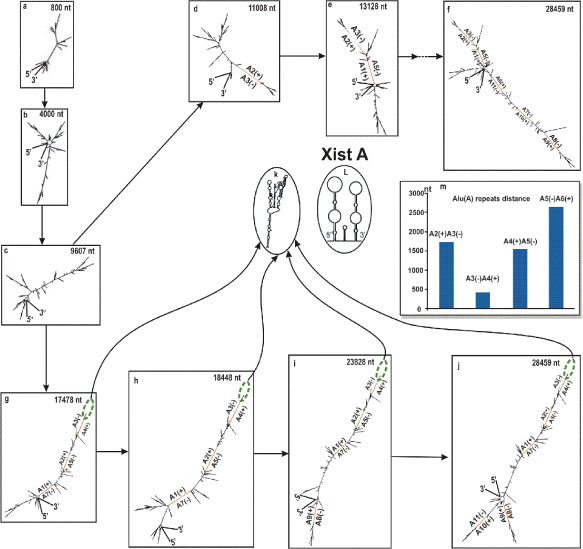
To study the role and structural property of Alu cluster at the beginning of GABRB3 gene at the level of RNA, we carried out modelling of intron RNA folding in steps. Starting from the minimum (800 nt), the length of fragments was incremented discretely, adding new Alu repeat with an adjacent sequence at each step. This model is equivalent to transcription with long pauses between steps. In a strict sense, this model is different from the native kinetic folding. As shown in figure 10, there are 2 chains. The upper one (Figure 10A-E) extends from Alu1 up to Alu 7. With the addition of Alu 7, further development of the folding following transcription elongation occurs along the lower chain (Figure 10G-J). In the histogram (Figure 10M) for the upper chain, the nuclei of dsAlu annealing are Alu 2 (+) and Alu3 (-), and according to the histogram, the interval between them is approximately 1700nt, whereas the interval between Alu 3 (-) and Alu4 (+) is approximately 400 nt. In the last case, the statistical frequency of annealing is about 2 times higher than between Alu 2 (+) and Alu3 (-). This difference logically follows from the assessment of dsAlu editing rate by enzyme ADAR [97]. It is assumed that this is the case for an average elongation rate for long introns (~ 3 knt/min). Thus, it follows that the nucleation of annealing for the whole cluster will be generated by the closest sense and antisense Alu, that is, by Alu 3(-) and Alu4 (+). Most likely, the lower chain is realized for an average rate of elongation inherent to long introns. In the special case of slow elongation or specific pauses, if any exist, the upper chain may by more preferential. After an addition of Alu7 and so on, the lower chain becomes thermodynamically more preferable then the upper chain.
Figure 10: Alu cluster folding at different steps corresponding to the addition of the next Alu repeat with the adjacent sequence. (A) - (F) Upper chain. (G) - (J) Lower chain. (J) Folding of intron 3, Gene id, as part of intron 3, GenBank. (K) Secondary structure of RNA product for branch B1. (L) Secondary structure of A-Xist fragment from [98]. (M) Histogram of the distances between Alu repeats.
Annealing of the more distant portions of whole chain (Alu5-11) will occur in accordance with the polarity of appearing in the nascent RNA and existing Alu repeats. The lower chain consists of 3 ds-Alu and intermediate fragments containing side branches, having the capacity of stiffening ribs. These fragments (inter Alu1-Alu2, inter Alu4-Alu5, inter Alu7-Alu8, 5’end - Alu1) are enriched in alternating Py and Pu-tracts without a significant type domination. This phenomenon prevents the fragment from folding into a tangle, which would occur for a smooth double-strand nucleotide fragment. After the addition of Alu7 and until the appearance of Alu8, the lengthening of the whole structure occurs at the expense of non-Alu sequences. The subsequent addition of Alu 8-Alu11 does not affect the length of the main telescopic structure.
An important apical branch B1 (~400 nt) between Alu 3 (-) and Alu4 (+) after annealing has the form close to the structure of A -Xist fragment, and in addition, has the same short oligomers (‘GGAUA’ motif) at the stem-loop junction (for a comparison, A-Xist fragment has fairly evenly distributed 8 repeats [98]), a mutation of this motif induces a decline in binding with Polycomb Repressive complex 2 (PRC2) [99]. This A-Xist directly interacts with the PRC2, which leads to X chromosome inactivation with participation of additional factors [100]. The consensus search for PRC2 binding was unsuccessful and led researchers to suggest promiscuity of PRC2 in association with RNA [101]; however, some preferences were determined (T>A, G>C). For B1 sequence, such preferences are fulfilled (Figure 3, as red spots for ‘GGAUA’ repeat density higher 5 motif/knt). For structural preferences, small RNAs interacting with PRC2 possess 2 stem-loop structures similar to those present within A-Xist RNA, and they have the potential to interact with PRC2, as experimentally established [102]. It is known that PRC2 interacts also with ncRNA and intronic RNAs and, in this regard, our apical structure B1 also has many similarities with 2 stem-loop structures as well as with A-Xist structure (compare structures (L) and (K) in Figure 10L,K). These findings are consistent with ideas about the properties of RNA binding site of the PRC2 complex.
The preference of the whole structure due to its length leads to its ability to be exhibited far into the nuclear space, and undoubtedly, due to many degrees of freedom, facilitates the ability to scan the space and cross the area of nucleus as well as to reach distant portion of the same chromosome.
Later in the text, we will show that clusters of significant nucleosome positioning are localized in the downstream area, and this will make the functioning of the complex more efficient in transcriptional silencing in tissues with high levels of PRC2 components. In summary, we can say that in many tissues, the Alu cluster in variant 1,2 (especially in foetal form) may be responsible for one of the possible mechanisms of transcription silencing due to the Alu cluster structure and nearest NP clusters in the long intron. The components of PRC2 complex are not enriched in the brain compared with many other tissues according to the Proteomics data [69], and this associates with expression in brain mostly at a foetal development stage. For a transcriptional variant 3 (truncated variant 1,2 incorporating the deletion of Alu cluster) the expression is allowed in some other tissues, in addition to brain, as mentioned above. However, variant 3 (Figure 5) also contains some cryptic structural variant of already considered Alu cluster structure, e.g., a prolonged structure with an apical B11-14 substructure (Intron 1(6’)) and special ‘GGAUA’ motifs in dense localization with TGrich content in B12.
Nucleosome position mapping
In figure 11-V, W, we suggest two variants of averaging of nucleosome positioning signal (NP) within sliding windows of two sizes (small and large). It is shown that the distinction exists between (a), (d) fragments and remaining portion of the gene (Figure 11V). Fragment (a) is characterized by alternation of the highest and lowest NP signals, which means the presence of tightly DNA-associated histone octamers isolated by a zero signal from each other, which would probably hamper the formation of a nucleosome cluster and complicate transcriptional elongation. To overcome this hindrance, the participation of the remodelling proteins will be required. These proteins, according to different models, can shift histone octamers by a ratchet mechanism or may lead to the histone octamer eviction [103] and thus eliminate the elongation hindrance. These proteins are part of the SWI/SNF(ISWI) and SAGA complexes [104-107]. According to the Proteomics data [69], these proteins (at least the motor BRG1 and SNF2h ones) have sufficiently high levels in the brain compared with the average level. Fragment (d) corresponding to GABRB3-GABRA5 intergene region also has many peaks and dips in the NP signal (Figure 11V).
Figure 11: Scheme of the locus, intron reads and mapping of NP and CTCF on DNA sequence. (A) Boxplot, number of reads per introns of GABRB3 gene. (B) Number of reads per introns of GABRA5 gene. (C) - (U) Scheme of the locus as in Figure 1. The skipping exons are presented for some transcripts in oval (C),(L), and UTR in half-oval (G). (V) Mapping of NP (averaging in short window). (W) Mapping of NP (averaging in larger window). (X) Mapping of CTCFbinding sites. (Y) Histogram of the number of reads per intron length (GABRB3 gene) https://www.ncbi.nlm.nih.gov/gene/2562.
In another situation of II-IX sites the nucleosome clusters may form to be detected when averaging in a sliding window of a larger size. These sites may be transformed to the silencing with the introduction of epigenetic marks that may be generated in the presence of PRC2 complex. It is important to note that, as shown earlier, sites III, IV are localized downstream of a bi-directional Alu cluster together with the apical B1 branch that has some A-Xist– like properties. The oblong secondary RNA structure of the bi-directional Alu cluster with the A-Xist–like spacer may serve as a substrate for the PRC2 complex. This may help the sites III, IV to be transformed to silence state. An additional important observation is that peaks III, IV together with CTCF [28] peak III (Figure 11X) alternate with peaks of SRSF2 binding sites (Figure 2J, Figure 3, dark violet spots) in the region adjacent to the 5’-end of intron 3 (GenBank, GABRB3 gene). The same situation is identified for CTCF peaks (Figure 11X) and NP peaks V-VII (Figure 11W) at the beginning of GABRA5. It should be noted that SRSF2 protein helps to release RP-II from transcription pauses [70, 71], while strong nucleosome positioning peaks as well as CTCF peaks may be the reason of elongation pauses.
In figure 11A, Y, the numbers of reads for each intron are presented from the GenBank data. The introns closer to the 3’-end have a higher level of reads than in the middle and more than in the large intron at the 5’-end. This finding is in accordance with the notion that nucleosomes concentrate at the exon edge compared with intron bodies [108]. It is difficult to present unambiguous explanation for this observation. This observation may be related to transcriptional and processing retardation closer to the 3’- end (usually with high exon density), or different levels of transcriptional initiation from the p1, p5 and p6 promoters. This explanation is more likely in the case of the On-line detection system. Another explanation is the possibility of exon-circle formation with the inclusion of introns. The existence of circles formed by exon RNA was detected for GABRB3 gene [109].
The data in this and previous sections show that the twolevel regulation of transcription depends in each tissue upon availability of remodelling or repressive proteins associated with the SWI/SNF (ISWI), SAGA or PRC2 complexes.
Homologous chromosome pairing
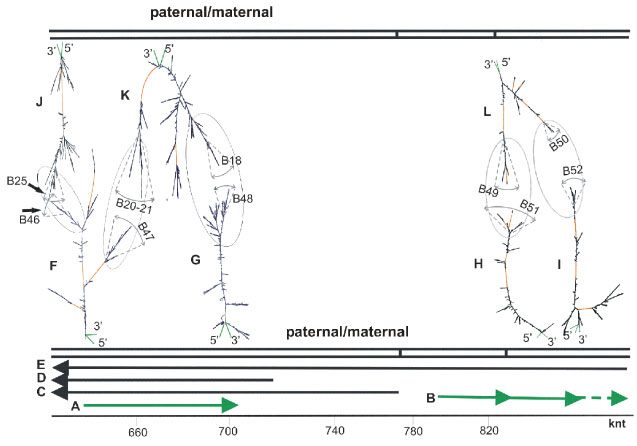
In Diptera, the homologous chromosome somatic pairing is widespread and is transcription-dependent [29,110,111]. At least the first stage of this process is in a good agreement with the availability and abundance of bidirectional transcripts in the locus. In addition to Diptera, the homologues pairing was also observed in Homo sapiens at some loci, namely, in 15q11-12 [29,112]. Bidirectional transcripts in this locus were shown by GeneBank resources as annotated mRNA and by in silico-predicted variants, as well as by availability of bidirectional EST (Figure 1T,U). We studied a secondary structure of large intron RNA as part of long bidirectional transcripts by UNAFOLD (Figure 12). Similarly, to the previous cases, the branches may be considered as multiple stable stem-loops substructures with spatially oblong traits. They have approximately the same coordinates on nucleotide sequence (Table S1) and many incidences of complementarity between ss loops in stem-loop structures of branches, namely, complementary sequences of loops in pair of branches, e.g. B25 (intron 8, Gene id, (-) strand) and B46 (chr15.137, intron 1, Genscan, (+) strand), B20-21 (intron 7, Gene id, (-) strand) and B47 (chr15.37, intron1, Genscan, (+) strand), B18 (intron 7, Gene id, (-) strand) and B48 (chr15.137, intron 4, Genescan, (+) strand), B51 (chr15.140, intron 1, Genscan (+) strand) and B49 (part of transcriptional variant CL749803, figure 1L, (-) strand) as well as B52 (chr15.140, intron 2, Genscan,(+) strand) and B50 (part of transcription variant CL749803, figure 1L, (-) strand). Transcription variant CL749809 was revealed at least in retina. In other tissues, this portion of bidirectional predictions of pairing related to CL749809 remains questionable, although the bidirectionality of EST (Figure 1T,U) supports homologues pairing in wide region. For further justification, we successfully attempted to elucidate the elements of tertiary structure by simulation of ss loop complementary sequences annealing by short oligonucleotides that also confirms the possibility of homologous pairing. As shown, the deletion variants that failed to provide homologous pairing are connected with multiple forms of diseases.
Figure 12: Scheme of bidirectional transcripts for 15q11-12 locus and images of folding structures of intron RNA. (A) chr15.137, Genscan, in green. (B) chr15.140, Genscan, in green. (C) GABRB3 transcript, var1,2, GenBank. (D) Transcript GABRB3, var3, GenBank. (E) CR749803 (Table S1). (F) chr15.137, intron 1, Genscan. (G) chr15.137, intron 4, Genscan. (H) chr15.140, intron 1, Genscan. (I) chr15.140, intron 2, Genscan. (J) intron 8, Gene id, part of intron 3, GenBank). (K) intron 7, Gene id, part of intron 3, GenBank). (L) part of intron1, Table S1, transcription variant CL749803, Figure 1L).
Conclusion
While studying the thermodynamically equilibrated secondary structures of long intron RNAs, some reproducible substructures are identified. These substructures are the most important results, and they are reproduced in optimal and sub-optimal variants of folding. Many of them are framed by dsAlu repeats and are associated with areas enriched in sites of RNA-binding proteins. For an area in the long first intron adjacent to pre-mRNA 5-end (GABRB3, variant1,2) with the cluster of bidirectional Alu repeats, the elongated secondary substructure incorporating a chain of dsAlu repeats (3 units) is identified with an apical stemloop A-Xist–like branch (A-Xist fragment interacting with PRC2 and pertaining to X chromosome inactivation). The formation of this chain of 3 dsAlu repeats has the preference of occurring at a high elongation rate. While mapping the NP signal on DNA, we also found nearby nucleosome clusters on the nucleotide sequence that may lead to transcriptional silencing upon interaction with PRC2. Components of PRC2 complex in the brain are below average levels in comparison with many tissues. For this reason, we may conclude that the silencing potential is more characteristic of other tissues than the brain. Transcription variants 1 and 2 are expressed only in the brain. Moreover, truncated variant 3 with the deletion of Alu cluster has an expanded range of tissue expression.
The main part in the centre of the first long intronic RNA (GABRB3, variant1,2 and partially variant 3) can recruit RNAbinding serine-arginine proteins SRSF1,2, PTB P and/or NS. Other portions have potential binding sites for hnRNP C, L, G, and YY1 binding proteins. This potential binding to different proteins is tissue-dependent, which should correspond with their concentration levels in the nucleus (Proteomics data). The evaluation of the effect of RNA secondary structure on binding argues in favor of weakening of RBP (SRSF1,2, PTB P, hnRNP C) attachment on average compared to fully unstructured variants. According to statistical data, the first long introns are subject to post-transcriptional splicing more frequently than others, and therefore, they can potentiate the creation of the elevated component levels of the future spliceosome as a whole in the GABRB3 gene region up to the transcriptional termination. An area adjacent to the pre-mRNA 3’-end with a higher number of intron-exon alternations (GABRB3, variant1-4) is also enriched in serinearginine protein SRSF1,2 RNA-binding sites and strong isolated NP signals reducing the transcription rate. All of these reasons may explain, to some extent, the changes in processing efficiency in this region (processing slowdown and/or increasing accuracy of splicing).
An area in the long first intron adjacent to the pre-mRNA 5’-end (GABRB3, in variant 1,2 and partially in variant 3) is enriched in NP clusters, in CTCF binding sites, in cryptic polyadenylation sites, provoking transcription pausing and SRSF2 binding sites in a tissue-specific manner that may facilitate the participation of SRSF2 protein in RP-II pause release and, as a whole, in accelerating the transcription up to high rate of elongation characteristic of long introns. A similar situation was identified for an area adjacent to the pre-mRNA 5’-end (GABRA5).
For the 15q11-12 locus, the chromosome homologous somatic pairing in human genome was identified as a rare event, in contrast to a similar frequent phenomena characteristic of Diptera, for which such events are associated with the presence of numerous bidirectional transcripts at the sites of pairing. For locus 15q11-12, we also identified bidirectional transcripts in the GenBank as annotated ones as well as in silico predicted. Folding of long intron RNAs in pairs of corresponding bidirectional transcripts also identified some reproducible substructures with almost identical coordinates that may easily interact with each other by numerous motif annealing in ss loops for (+) and (-) strands, thus initiating the homologous pairing.
Acknowledgement
We are grateful to Ryazanskii S.S. for technical assistance in computer service and providing technical support, Suzdaleva M.V. and Mikhailova K.B. for technical help.
There are no references
