Journal Name: Journal of Drug Development and Delivery
Article Type: Research
Received date: 13 December, 2018
Accepted date: 21 December, 2018
Published date: 28 December, 2018
Citation: Pavani B, Harshavardhan B, Sindhu Priya G, Sharanya K, Kanchan (2018) Method Development and Validation of Bosentan by Uv-Spectrophotometric Method. J Drug Dev Del Vol: 1, Issu: 1 (34-38).
Copyright: © 2018 Pavani B. This is an open-access article distributed under the terms of the Creative Commons Attribution License, which permits unrestricted use, distribution, and reproduction in any medium, provided the original author and source are credited.
Abstract
A novel, safe, sensitive and easiest method of UV-spectro photometric method has been developed for the assay of Bosentan in its API and pharmaceutical dosage form. Method has been developed and validated using diluents like 0.1N sodium hydroxide at 261nm. All parameters were validated using ICH guidelines and Linearity was observed in the range 4-20 μg /ml for Bosentan (r2 =0.999) for the amount of drugs estimated by the proposed methods was in good agreement with the label claim.
Keywords
Spectrophotometric method, ICH, Bosentan, Sodium hydroxide.
Introduction
Ultraviolet-Visible spectrophotometry method
UV-Visible spectrophotometry is one of the most used methods in pharmaceutical analysis. This method involves measuring the amount of UV-Visible radiation absorbed by a drug in solution form. Instrument measures the ration of intensities of two lights in the UV-Visible region.
In qualitative analysis, drugs most are organic compounds can be identified by use of spectrophotometer, if any previous recorded data available for same compound. In quantitative analysis, quantity of compound is measured by studying the absorption radiation study of compound. UV-Visible spectrophotometric method is simple, rapid, specific and applicable to small quantities of compound [1].
Fundamental law that governs the quantitative spectrophotometric analysis is Beer-Lambert Law: when beam of light is passed through a transparent cell containing a solution of an absorbing substance, reduction of the intensity of light is mathematically calculated by using Beer-Lamberts law and it is expressed as follows,
A=abc
Where, A=absorbance, a=absorptivity, b=path length and c=concentration of solute in solution
Quantification of medical compound using UV-Visible spectrophotometer may carried out by preparing solution in transparent solvent and measuring it’s absorbance at suitable wavelength [2-4]. The wavelength normally selected is wavelength of maximum absorption (lamda max). For assay of substance in multi component sample by spectrophotometer; the following methods are being used,
- Simultaneous estimation method
- Derivative spectrophotometric method
- Absorbance ratio method
- Difference spectrophotometry
- Solvent extraction method
Drug introduction
Bosentan: Bosentan is a dual endothelin receptor antagonist important in the treatment of pulmonary artery hypertension (PAH). It is licensed in the United States, the European Union and other countries by Actelion Pharmaceuticals for the management of PAH under the trade name Tracleer®. Bosentan is used to treat pulmonary hypertension by blocking the action of endothelin molecules that would otherwise promote narrowing of the blood vessels and lead to high blood pressure [5,6].
Endothelin-1 (ET-1) is a neurohormone, the effects of which are mediated by binding to ETA and ETB receptors in the endothelium and vascular smooth muscle. ET-1 concentrations are elevated in plasma and lung tissue of patients with pulmonary arterial hypertension, suggesting a pathogenic role for ET-1 in this disease [7]. Bosentan is a specific and competitive antagonist at endothelin receptor types ETAand ETB. Bosentan has a slightly higher affinity for ETA receptors than for ETB receptors.
Bosentan is eliminated by biliary excretion following metabolism in the liver. Terminal elimination half-life is about 5 hours in healthy adult subjects. Bosentan is metabolized in the liver by the cytochrome P450 enzymes CYP2C9 and CYP3A4 (and possibly CYP2C19), producing three metabolites, one of which, Ro 48-5033, is pharmacologically active and may contribute 10 to 20% to the total activity of the parent compound.
Methodology
Requirements
Table 1; Table 2
Table 1: Requirements for Analysis of Bosentan by UV spectrophotometry.
| Requirement | Manufacturer/Source |
|---|---|
| Calibrated UV visible spectrophotometer | Shimadzu UV – 1800 |
| Calibrated electronic balance | Shimadzu |
| Bosentan | Cipla Ltd |
| Bosentan tablets | 125mg |
| Volumetric flasks(10, 25, 1000 ml) | Class BBorosil |
| Pipettes ( 2,ml) | Class BBorosil |
| Beakers (50, 100, 250 ml) | Borosil |
| Simple distilled water | BhanuMini Quartz distiller |
Table 2: Formulation for UV analysis.
| Brand name | Bosentas |
|---|---|
| Active ingredient | Bosentan |
| Manufacturer | Cipla Ltd |
| Dosage form | Tablet- coated |
| Label claim | 125 mg |
| Package | Blister – 10tablets per package |
| Expiry date | 07/2020 |
Choice of solvent
- With reference to Official compendia (E.P, B.P), it was found that Bosentan is sparingly soluble in water.
- Solubility check of the drug in various solvents like 0.1M Hydrochloric acid and 0.1MNaOH revealed the free solubility of drug in 0.1NSodiumhydroxide owing to the weak basic nature of drug.
- Hence 0.1N Sodium hydroxide was chosen as solvent for UV spectrophotometric analysis which gave distinct spectrum with Gaussian distribution and good absorbance.
Determination of λmax
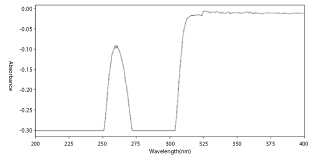
By trial and error, the λmax of Bosentan in 0.1N sodium hydroxide by UV spectrophotometer was found to be 261.00 nm.
Method validation
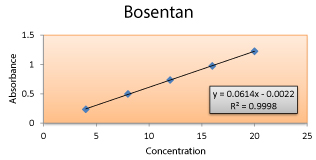
Linearity and range: Linearity for the concentration range 4- 20μg/ ml was established by plotting concentrations on X- axis and corresponding absorbance on Y- axis. Statistical parameters like correlation coefficient (R2), line equation including slope (m), y- intercept (C) were determined.
The specified range was derived from linearity studies by determining the difference between highest and lowest concentrations.
Precision
Intraday precision (repeatability): Repeatability of the developed method was assessed by 9 Determinations covering 3 concentrations each of 3 replicates. % RS was calculated for the results.
Interday precision: Variations in the results for the developed method was assessed amidst 3 different days (n= 6). % RSD was calculated for the results obtained.
Limit of detection and limit of quantitation: LOD and LOQ were determined by instrumental methods based on the standard deviation of the response (blank sample) and slope of the calibration curve.
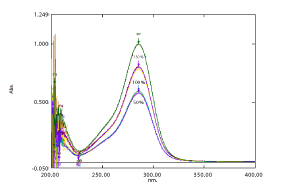
Accuracy: Accuracy of the method was confirmed by recovery studies from marketed formulation at three levels of standard addition from 50%, 100% and 150 % of label claim. The recovery studies were carried out in triplicate.
Preparation of 50% solution: 0.5ml of sample stock solution (5μg/ ml) and 0.25 ml of above standard stock solution II were pipetted out into a 10ml volumetric flask and diluted up to the mark with diluent.
Preparation of 100% solution: 0.5ml of sample stock solution (5μg/ ml) and 0.5 ml of above standard stock solution II were pipetted out into a 10ml volumetric flask and diluted up to the mark with diluent.
Preparation of 150% solution: 0.5 ml of sample stock solution (5μg/ ml) and0.75ml of above standard stock solution II were pipetted out nto a 10ml volumetric flask and diluted up to the mark with diluent.
Applicability of the developed validated method by ultraviolet spectrophotometry
Assay of formulation: 20 tablets were weighed accurately and average weight of tablet was noted that constitutes 125 mg Bosentan and was finely powdered.
The tablet powder equivalent to 0.0175mg of Bosentan was accurately weighed and transferred to 10 ml volumetric flask and dissolved in about 5 ml of the solvent (0.1 N Sodium hydroxide).
It was then vortexed for 30 minutes to enhance maximum extraction of the active pharmaceutical ingredient from the dosage form and filtered through Whatmann No 1 filter paper to remove insoluble excipients to the maximum extent.
It was then made upto the volume with the same solvent. This constitutes 10μg/ ml of Bosentan.
From the stock solution, aliquot corresponding to medium concentration of standard curve (12μg/ ml) was prepared and made upto the mark with the solvent.
The absorbance was noted and the corresponding concentration was then determined from the standard calibration curve.
Results and Discussion
Method development and validation of Bosentan drug by UV
Determination of λmax of Bosentan: Figure 1
Figure 1: λmax of Bosentan.
Method validation
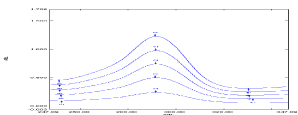
Linearity: The results obtained were within the range from the linearity set, shows good correlation coefficient value (0.9998). Figure 2 and 3; Table 3
Figure 2: Overlay Spectra of Bosentan (4-20 μg/ ml).
Figure 3: Calibration Curve for the Linearity Set at 261.00 nm by UV Spectrophotometry.
Table 3: Linearity Profile by UV Spectrophotometry.
| Concentration (µg/ ml) | Absorbance at 261.00 nm |
|---|---|
| 4 | 0.237 |
| 8 | 0.498 |
| 12 | 0.736 |
| 16 | 0.976 |
| 20 | 1.226 |
Precision
Intra-day precision (Repeatability): Table 4-6
Table 4: Intra-day Precision Day- I by UV Spectrophotometry.
| Conc (µg/ ml) | Absorbance | Average | SDa | % RSDb | ||
|---|---|---|---|---|---|---|
| Set 1 | Set 2 | Set 3 | ||||
| 4 | 0.236 | 0.238 | 0.235 | 0.236333 | 0.001528 | 0.646344 |
| 8 | 0.496 | 0.499 | 0.497 | 0.497333 | 0.001528 | 0.307143 |
| 12 | 0.735 | 0.737 | 0.736 | 0.736 | 0.001 | 0.13587 |
Table 5: Intra-day Precision Day- II by UV Spectrophotometry.
| Conc (µg/ ml) | Absorbance | Average | SD | % RSD | ||
|---|---|---|---|---|---|---|
| Set 1 | Set 2 | Set 3 | ||||
| 4 | 0.237 | 0.236 | 0.235 | 0.236 | 0.001 | 0.423729 |
| 8 | 0.497 | 0.498 | 0.496 | 0.497 | 0.001 | 0.201207 |
| 12 | 0.737 | 0.735 | 0.736 | 0.736 | 0.001 | 0.13587 |
Table 6: Intra-day Precision Day- III by UV Spectrophotometry.
| Conc (µg/ ml) | Absorbance | Average | SD | % RSD | ||
|---|---|---|---|---|---|---|
| Set 1 | Set 2 | Set 3 | ||||
| 4 | 0.236 | 0.235 | 0.238 | 0.2363 | 0.001528 | 0.646344 |
| 8 | 0.497 | 0.498 | 0.499 | 0.498 | 0.001 | 0.200803 |
| 12 | 0.735 | 0.736 | 0.737 | 0.736 | 0.001 | 0.13587 |
| a= Standard Deviation, b= Percentage Relative Standard Deviation | ||||||
Inter-day precision: The developed method was found to be precise as the % RSD of the results within and amidst 3 days was within limits (< 2.0).Table 7
Table 7: Inter-day Precision by UV Spectrophotometry.
| Conc (µg/ ml) | Absorbance | Average | SD | % RSD | |||||
|---|---|---|---|---|---|---|---|---|---|
| Set 1 | Set 2 | Set 3 | Set 4 | Set 5 | Set 6 | ||||
| 4 | 0.238 | 0.235 | 0.236 | 0.237 | 0.235 | 0.236 | 0.23616 | 0.001169 | 0.495009 |
| 8 | 0.499 | 0.497 | 0.498 | 0.497 | 0.498 | 0.496 | 0.4975 | 0.001049 | 0.210816 |
| 12 | 0.737 | 0.736 | 0.735 | 0.737 | 0.736 | 0.735 | 0.736 | 0.000894 | 0.121525 |
Limit of detection: LOD = 3.3 δ/ m
= 3.3× 0.001528/ 0.0614
= 0.082124μg
Limit of quantitation: LOQ = 10 δ/ m
= 10× 0.001528/ 0.0614
= 0.24886μg
The obtained results for Limit of Detection (LOD) and Limit of Quantification (LOQ) were satisfactory.
Accuracy: *Average of 3 experiments
Acceptance Criteria: The % Recovery for each level should be between 98.0 and 102.0%
The developed method was found to be accurate since % recovery for each level was within limits and RSD less than 2.0.Figure 4; Table 8
Figure 4: Overlay Accuracy Spectra of BOSENTAN by UV Spectrophotometry.
Table 8: Recovery from Formulation (Bosentan tablets)by UVspectrophotometry.
| Bosentan in dosage form (µg ml-1) |
% Pure Bosentan added | Pure Bosentan Added(µg ml-1) |
Bosentan Recovered% ± %rSD* |
|---|---|---|---|
| 5 | 50% | 2.5 | 101.02 ± 1.17 |
| 5 | 100% | 5 | 101.90 ± 1.12 |
| 5 | 150% | 7.5 | 102.00 ± 0.17 |
| *Average of 3 experiments | |||
Applicability of the developed validated method by ultraviolet spectrophotometry
Assay of formulation: Acceptance criteria: 95- 105% w/v
The assay results were decorous in conjunction with acceptance criteria. Table 9
Table 9: Assay of formulation (Bosentan 125mg tablets) by UV spectrophotometry.
| Formulation | Absorbance | Label claim | Amount found | % Assay ± SD* |
|---|---|---|---|---|
| Bosentan | 0.741 | 125 mg | 11.934 | 99.45% |
| 0.735 | ||||
| 0.731 |
Discussion
The proposed methods were validated. The accuracy of the methods was assessed by recovery studies at three different levels. Recovery experiments indicated the absence of interference from commonly encountered pharmaceutical additives. The method was found to be precise as indicated by the repeatability analysis, showing %RSD less than 2. All statistical data proves validity of the methods and can be used for routine analysis of pharmaceutical dosage form.
Conclusion
From the above experimental results and parameters it was concluded that, this newly developed method for the estimation of Bosentan was found to be simple, precise and accurate; this method more acceptable and cost effective and it can be effectively applied for routine analysis in research institutions, quality control department in meant in industries, approved testing laboratories studies in near future.
There are no references


