Journal Name: Journal of Drug Development and Delivery
Article Type: Research
Received date: 13 December, 2018
Accepted date: 24 December, 2018
Published date: 30 December, 2018
Citation: Deshpande K, Tadimarri VS, Ghosh B, Uppalapati Y (2018) To Develop A New UPLC Method for Estimation of Topiramate In Pharmaceutical Dosage Forms. J Drug Dev Del Vol: 1, Issu: 1 (21-27).
Copyright: © 2018 Deshpande K. This is an open-access article distributed under the terms of the Creative Commons Attribution License, which permits unrestricted use, distribution, and reproduction in any medium, provided the original author and source are credited.
Abstract
A simple and selective UPLC method is described for the determination of Topiramate Chromatographic separation was achieved on a c18 column using mobile phase consisting of a mixture of 80 volumes of Methanol and 20 volumes of Water with detection of 276 nm. Linearity was observed in the range 50-150 μg /ml for Topiramate (r2 =0.998) for the amount of drugs estimated by the proposed methods was in good agreement with the label claim.
Introduction
Ultra Performance Liquid Chromatography
UPLC refers to Ultra Performance Liquid Chromatography. It has Equipment that operates at high pressure than that used in HPLC & in this system uses fine particles(less than 2.5μm) & mobile phases at high linear velocities decreases the length of column, reduces solvent consumption & saves time.
According to the van Deemter equation, as the particle size decreases to less than2.5 μm, there is a significant gain in efficiency, while the efficiency does not reduce at increased flow rates or linear velocities therefore by using smaller particles, speed and peak capacity (number of peaks resolved per unit time in gradient separations) can be extended to new limits, termed Ultra Performance Liquid Chromatography, or UPLC The technology takes full advantage of chromatographic principles to run separations Using columns packed with smaller particles (less than 2.5μm) and/or higher flow rates for increased speed, this gives superior resolution and sensitivity.
Principle
The UPLC is based on the principal of use of stationary phase consisting of particles less than 2.5 μm (while HPLC columns are typically filled with particles of 3 to 5 μm).
H=A+B/v+Cv
Where;
A, B and C are constants
v is the linear velocity, the carrier gas flow rate.
*The A term is independent of velocity and represents “eddy” mixing. It is smallest when the packed column particles are small and uniform.
The B term represents axial diffusion or the natural diffusion tendency of molecules. This effect is diminished at high flow rates and so this term is divided by v.
* The C term is due to kinetic resistance to equilibrium in the separation process. Thus, term is proportional to v.
Advantages of UPLC
- Decreases run time and increases sensitivity
- Provides the selectivity, sensitivity, and dynamic range of LC analysis.
- Maintaining resolution performance.
- Expands scope of Multi residue Methods.
- UPLC’s fast resolving power quickly quantifies related and unrelated compounds
- Faster analysis through the use of a novel separation material of very fine particle size
- Operation cost is reduced
- Less solvent consumption
- Reduces process cycle times, so that more product can be produced with existing resources
Disadvantages
- Due to increased pressure requires more maintenance and reduces the life of the columns of this type.
- So far performance similar or even higher has been demonstrated by using stationary phases of size around 2 μm without the adverse effects of high pressure.
- In addition, the phases of less than 2 μm are generally non-regenerable.
Instrumentation
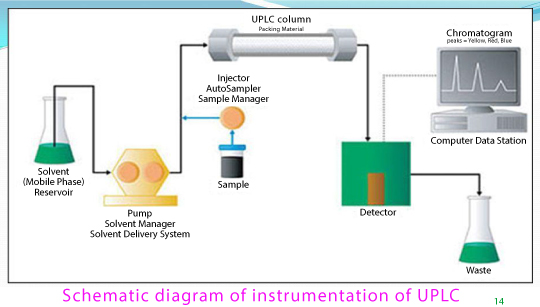
The Ultra Performance Liquid Chromatography have the ability to work more efficiently with higher speed, sensitivity and resolution at a much wider range of linear velocities, flow rates and backpressures to obtain superior results Figure 1.
Figure 1: Schematic diagram for UPLC instrument.
The Acquity UPLC system consists of
- Sample Injection
- UPLC Column
- PST Columns
- Solvent Delivery System
- The Detector
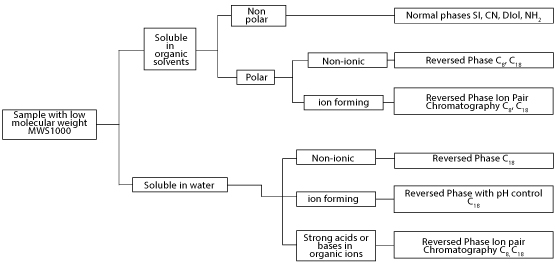
Guidelines for Analytical Method Development Figure 2.
Figure 2: Guidelines for analytical method development.
Selection of the Chromatographic Method
The parameters that are affecting by the changes in chromatographic conditions are:
- Column efficiency (N)
- Capacity factor (K’)
- Resolution factor (RS)
- Retention Factor (Rf)
- Retention time (Rt)
- Relative retention (Rr)
- Peak asymmetry factor (As)
Selection of validation method

Guidelines for Analytical Method Validation Method Validation

Performance characteristics to be considered during the validation of a quantitative method in analysis.
Drug Profile
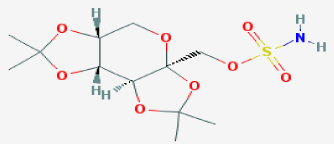
Drug Name: TOPIRAMATE Figure 3.
Figure 3: Chemical structure.
IUPAC Name
[(1R,2S,6S,9R)-4,4,11,11-tetramethyl-3,5,7,10,12- pentaoxatricyclo[7.3.0.0²,⁶]dodecan-6-yl]methyl sulfamate
Categories
- Anti-Obesity Agents
- Anticonvulsants
- Carbohydrates
- Central Nervous System Agents
- Central Nervous System Depressants
- Cytochrome P-450 CYP2C19 Inhibitors
Synonyms
- 2 , 3 : 4 , 5 - B i s - O - ( 1 - m e t h y l e t h y l i d e n e ) - b e t a - D - fructopyranose sulfamate
- 2,3:4,5-Di-O-isopropylidene-beta-D-fructopyranose sulfamate
- McN-4853
- RWJ-17021
- Tipiramate
- Tipiramato
- Topiramate
- Topiramato
- Topiramatum
Chemical Formula
C12H21NO8S
Molecular Weight
339.362
Mechanism of Action
The precise mechanism of action of topiramate is not known. However, studies have shown that topiramate blocks the action potentials elicited repetitively by a sustained depolarization of the neurons in a time-dependent manner, suggesting a state-dependent sodium channel blocking action. Topiramate also augments the activity of the neurotransmitter gamma-aminobutyrate (GABA) at some subtypes of the GABAA receptor (controls an integral chloride channel), indicating a possible mechanism through potentiation of the activity of GABA.
Materials and Methods
Mobile Phase: A mixture of, 80 volumes of Methanol, and 20 volumes of Water. The mobile phase was sonicated for 10 min to remove gases Table1-3.
Table 1: Instruments used.
UV-Visible Spectrophotometer |
Nicolet evolution 100 |
UV-Visible Spectrophotometer software |
Vision Pro |
UPLC software |
Open lab EZ chrome |
UPLC |
Agilent Technologies |
Ultra sonicator |
Citizen, Digital Ultrasonic Cleaner |
pH meter |
Global digital |
Electronic balance |
Mettler Toledo |
Syringe |
Hamilton |
UPLC Column |
Inertsil ODS 3V(150x4.6mm) 4µm |
Table 2: Reagents used.
Water |
HPLC Grade |
Methanol |
HPLC Grade |
Potassium Dihydrogen Phosphate |
AR Grade |
Acetonitrile |
HPLC Grade |
Dipotassium hydrogen phosphate |
AR Grade |
Orthophosphoric acid |
HPLC Grade |
Table 3: Drugs used.
TOPIRAMATE (API) |
Gift Samples obtained from Chandra labs, Hyd. |
TOPIRAMATE (25 mg) |
Obtained from local pharmacy |
Table 4: Optimized chromatographic conditions.
Mobile phase |
Methanol: WATER (80:20) |
Ph |
- |
Column |
Inertsil ODS 3V column, C18(150x4.6 ID) 5µm |
Flow rate |
1.0 ml/min |
Column temperature |
Room temperature(20-25oC) |
Sample temperature |
Room temperature(20-25oC) |
Wavelength |
276 |
Injection volume |
20 µl |
Run time |
6 min |
Retention time |
About 1.277 min for Topiramate |
Determination of Working Wavelength (λmax)
Preparation of standard stock solution of Topiramate: 10 mg of Topiramate was weighed and transferred in to 100ml volumetric flask and dissolved in methanol and then make up to the mark with methanol and prepare 10 μg /ml of solution by diluting 1ml to 10ml with methanol.
Results
The wavelength of maximum absorption (λmax) of the drug, 10 μg/ml solution of the drug in methanol were scanned using UV-Visible spectrophotometer within the wavelength region of 200–400 nm against methanol as blank. The resulting spectra are shown in the 8.3 and The absorption curve shows characteristic absorption maxima at 276nm for Topiramate, selected as detector wavelength for the UPLC chromatographic method.
Method Development of Topiramate
Various analytical development trails has been performed by using different chemicals and reagents, organic solvents at different pH ranges and strengths in differents proportions of buffer and organic solvents to separate the peak shape. Based on the observations and conclusions obtained from the no.of chromatographic trails performed on UPLC, a particular set of chromatographic conditions were optimized to be suitable for estimation of the Topiramate in the tablets. The optimized chromatographic conditions which are found to be suitable for the estimation of Topiramate are given below.
Method Validation
System suitability
Standard solutions were prepared as per the test method and injected into the chromatographic system. The system suitability parameters like retention times, theoretical plates, asymmetric factor were evaluated.
Assay
Preparation of standard solution: Weigh accurately 10 mg of Topiramate in 25 ml of volumetric flask and dissolve in 25ml of mobile phase and make up the volume with mobile phase. From above stock solution 20 μg/ml of Topiramate is prepared by diluting 0.5ml to 10ml with mobile phase. This solution is used for recording chromatogram.
Sample preparation: weigh accurately 10 Tablets (Topiramate -25 mg) weigh accurately 10 mg of Topiramate in 25 ml of volumetric flask and dissolve in 25ml of mobile phase and make up the volume with mobile phase. From above stock solution 20 μg/ml of Topiramate is prepared by diluting 0.5ml to 10ml with mobile phase. This solution is used for recording chromatogram.
Calculation
The amount of Topiramate present in the formulation by using the formula given below, and results shown in above table:
Linearity and range
Preparation of standard stock solution
Standard stock solutions of TOPIRAMATE were prepared by dissolving 100 mg of TOPIRAMATE in 100 mL of Diluent. After that filtered the solution using 0.45-micron syringe filter and Sonicated for 5 min.
Accuracy
Accuracy of the method was determined by Recovery studies. To the formulation (pre-analyzed sample), the reference standards of the drugs were added at the level of 50%, 100%, 150%. The recovery studies were carried out three times and the percentage recovery and percentage mean recovery were calculated for drug.
Results and Discussions
Method Development of Mirabegron
Trial-4: (Optimized), Trial- 4: (Optimized)
Chromatographic conditions
Mobile phase : Methanol; Water
- pH : -
- Ratio : 80 :20
- Column : Inertsil ODS, (250×4.6× 5μ)
- Wavelength : 276 nm
- Flow rate : 1ml/min
Preparation of standard solution
weigh accurately 10 mg of Topiramate in 25 ml of volumetric flask and dissolve in 25ml of mobile phase and make up the volume with mobile phase. From above stock solution 20 μg/ml of Topiramate is prepared by diluting 1.5ml to 10ml with mobile phase. This solution is used for recording chromatogram Figure 4.
Figure 4: Chromatogram of Topiramate.
Observation
- All the system suitability requirements were met.
- The peak Asymmetry factor was less than 2 for both Topiramate
- The efficiency was more than 2000 Topiramate.
- Resolution between two peaks >1.5.
- hence this method was for optimized.
- Assay: Table 5.
- System suitability: Table 6./li>
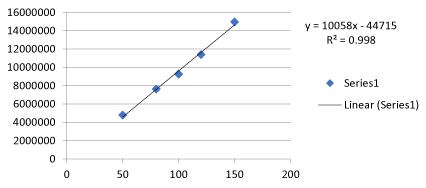
- Linearity and range: Table 7.
- Linearity data of TOPIRAMATE Table 8.
- Linearity graph of TOPIRAMATE Figure 5.
- Accuracy: Table 9.
- Method precision Table 10
Table 5: Assay Results.
| TOPIRAMATE | ||
|---|---|---|
| Standard Area | Sample Area | |
| Injection-1 | 9111785 | 9245257 |
| Injection-2 | 9128795 | 9272110 |
| Injection-3 | 9123101 | 9282820 |
| Injection-4 | 9101117 | 9257988 |
| Injection-5 | 9140105 | 9252085 |
| Average Area | 9120980.60 | 9262052 |
| Standard deviation | 15086.63 | |
| %RSD | 0.2 | |
| Assay(%purity) | 101.55 | |
Table 6: Results for system suitability of TOPIRAMATE.
| Injection | RT | Peak area | Theoretical plates (TP) | Tailing factor (TF) |
|---|---|---|---|---|
| 1 | 1.275 | 9128775 | ‹2000 | 1.82 |
| 2 | 1.289 | 9111985 | ‹2000 | 1.80 |
| 3 | 1.276 | 9108527 | ‹2000 | 1.79 |
| 4 | 1.278 | 9133128 | ‹2000 | 1.81 |
| 5 | 1.276 | 9152688 | ‹2000 | 1.80 |
| Mean | 1.28 | 9127020.6 | - | - |
| SD | 0.0058 | 17799.41 | - | - |
| %RSD | 0.45 | 0.20 | - | - |
Table 7: Linearity Preparations.
| Preparations | Volume from standard stock transferred in mL | Volume made up in mL (with mobile phase) | Conc. obtained (µg/mL) |
|---|---|---|---|
| TOPIRAMATE | |||
| Preparation 1 | 0.5 | 10 | 50 |
| Preparation2 | 0.8 | 10 | 80 |
| Preparation 3 | 1 | 10 | 100 |
| Preparation 4 | 1.2 | 10 | 120 |
| Preparation 5 | 1.5 | 10 | 150 |
Table 8: Linearity data of TOPIRAMATE.
| S. No | Concentration (µg/mL) | Area |
|---|---|---|
| 1 | 50 | 4795387 |
| 2 | 80 | 7638186 |
| 3 | 100 | 9269572 |
| 4 | 120 | 11393610 |
| 5 | 150 | 14961410 |
Table 9: Recovery results for TOPIRAMATE.
| %Recovery | Amount present (µg/mL) |
Amount found (µg/mL)* |
Percent |
% Mean Recovery |
|---|---|---|---|---|
| 50% | 50 | 49.64 | 99.3 | 99.3 |
| 100% | 100 | 99.04 | 99.0 | |
| 150% | 150 | 149.56 | 99.7 |
Table 10: Method precision results for TOPIRAMATE.
| S. No. | RT | AREA |
|---|---|---|
| 1> | 1.271> | 9231182> |
| 2> | 1.273> | 9241228> |
| 3> | 1.271> | 9231190> |
| 4> | 1.274> | 9231135> |
| 5> | 1.272> | 9241195> |
| 6> | 1.274> | 9231147> |
| AVG> | 1.273> | 9234512.83> |
| SD> | 0.00138> | 5188.82> |
| %RSD> | 0.108> | 0.056> |
Figure 5: Linearity graph of TOPIRAMATE.
Limit of Detection
Where, σ = the standard deviation of the response
S = the slope of the calibration curve
The slope S may be estimated from the calibration curve of the analyte.
Limit of Quantification (Loq)
Where
σ = the standard deviation of the response
S = the slope of the calibration curve
The slope S may be estimated from the calibration curve of the analyte.
Robustness
Chromatographic conditions variation
To demonstrate the robustness of the method, prepared solution as per test method and injected at different variable conditions like using different conditions like flow rate and wavelength. System suitability parameters were compared with that of method precision Table 11.
Table 11: Results for Robustness of TOPIRAMATE.
| Chromatographic changes | Rt(min) | Tailing Factor | Theoretical Plates | %RSD for Standard areas | |
|---|---|---|---|---|---|
| Flow rate (mL/min) |
0.4 | 1.712 | 1.75 | ‹2000 | 0.12 |
| 0.6 | 1.030 | 1.67 | ‹2000 | 0.11 | |
| Temperature (°C) |
25 | 1.282 | 1.77 | ‹2000 | 0.22 |
| 35 | 1.285 | 1.72 | ‹2000 | 0.19 | |
Ruggedness
The ruggedness of the method was studied by the determining the analyst to analyst variation by performing the Assay by two different analysts Table 12.
Table 12: Ruggedness Results of TOPIRAMATE.
| TOPIRAMATE | %Assay |
|---|---|
| Analyst 01 | 99.75 |
| Analyst 02 | 101.5 |
| %RSD | 0.27 |
Discussion
A simple and selective UPLC method is described for the determination of Topiramate Chromatographic separation was achieved on a c18 column using mobile phase consisting of a mixture of 80 volumes of Methanol and 20 volumes of Water with detection of 276 nm. Linearity was observed in the range 50-150 μg /ml for Topiramate (r2 =0.998) for the amount of drugs estimated by the proposed methods was in good agreement with the label claim.
The proposed methods were validated. The accuracy of the methods was assessed by recovery studies at three different levels. Recovery experiments indicated the absence of interference from commonly encountered pharmaceutical additives. The method was found to be precise as indicated by the repeatability analysis, showing %RSD less than 2. All statistical data proves validity of the methods and can be used for routine analysis of pharmaceutical dosage form.
Conclusion
From the above experimental results and parameters it was concluded that, this newly developed method for the estimation of TOPIRAMATE was found to be simple, precise, accurate and high resolution and shorter retention time makes this method more acceptable and cost effective and it can be effectively applied for routine analysis in research institutions, quality control department in meant in industries, approved testing laboratories studies in near future [1-13].
There are no references


