Journal Name: Journal of Health Science and Development
Article Type: Analysis
Received date: 18 August, 2020
Accepted date: 06 November, 2020
Published date: 2021-01-30
Citation: Cheng B, Wang YM (2020) Impacts of People’s Learning Behavior in Fighting the COVID-19 Epidemic. J Health Sci Dev Vol: 3, Issu: 2 (31-35).
Copyright: © 2020 Cheng B et al. This is an open-access article distributed under the terms of the Creative Commons Attribution License, which permits unrestricted use, distribution, and reproduction in any medium, provided the original author and source are credited.
Abstract
An important parameter for COVID-19 is the case fatality rate (CFR). It has been applied to wide applications, such as measuring the severity of the infection, estimating the number of infected cases, risk assessment etc. However, there remains a lack of understanding on CFR, including relevant important population factors, the apparent discrepancy of CFRs across different countries, and how the age effect rolls in. We analyze CFRs at two different time snapshots, July 6 and Dec 28, 2020, during the first and second wave of the COVID-19 pandemic with the later just before the wide adoption of COVID-19 vaccines. Two important population covariates, age and GDP—as a proxy for the quality and abundance of public health—are considered. Our exploratory data analysis leads to interesting findings. There is a clear exponential age effect among different age groups, and, strikingly, the exponential index is almost invariant (0.0715 Vs 0.0704) across countries and over time during the pandemic. Meanwhile, the roles played by the age and GDP are a little surprising: during the first wave, age is a more significant factor than GDP, while their roles have switched during the second wave of the pandemic, which we attribute to the delay in time for the quality of public health to factor in.
Keywords:
Epidemic, COVID-19, pandemic control, social distancing.
Introduction
The highly contagious and asymptomatic transmission nature of the novel coronavirus has led to the explosive spreading of the COVID-19 epidemic [1-5] and has drastically affected the world economy. Unlike past flu seasons (which required no social distancing because vaccines were available), slowing and controlling the COVID-19 pandemic requires immediate physical isolation, social distancing, and even community shelter in place orders. Without any intervention, the infection will follow a natural exponential growth path in time until most of the population is infected [6]. Social distancing plays a critical role in reducing the spread of the epidemic and flattens the infection curve. Many flu-based epidemic models [7-16] have been used to model the current pandemic, but because they do not take social distancing into account, these models have missed predicting the rate of spread and peak time of new infections. Recent studies [17-20] have attempted to address this issue. In this letter, we apply a novel epidemic mathematical model recently developed by Cheng and Wang [6] to quantify the impacts of social distancing and people’s learning behavior (isolating, wearing face masks, washing hands, avoiding gathering in groups, etc.). The model can be applied to a community of any size (country, state, county, or city) to predict the number of total infections, infection rate, time of peak new daily infections, and time to reach a plateau for cumulative infections (96% of the total infections of the epidemic). This study provides guidance for policy makers on when to reopen their community and economy.
Impacts of Social Distancing
A mathematical model is recently developed by Cheng and Wang to describes the COVID-19 epidemic [6]. This model is based on the principle of supply and demand for the virus and takes into account social distancing and people’s learning behavior. The model provides analytic solutions for the trajectory of the epidemic spread weeks in advance, including the number of total infections, daily infection rate, time of peak new infections, and time to reach the plateau. The total infected population P (t) at a given time and the number of daily new infections in the model are described by two functions, respectively, whereP0 is the number of infected people at time t0, γ is the community transmission rate, and d is the social distancing level that has values between dmin (no isolation or social distancing) and 1 (complete isolation or infinity social distancing) depending on people’s learning behavior. The minimum value of d is determined by , where η represents the fraction of the population who are naturally immune to the virus, and Pmax is the total population of the community. The termd denotes the time derivative of d, which is important when social distancing is not constantly maintained over time. Clearly, increased social distancing with time (d > 0)would reduce the daily infection rate. On the other hand, relaxing social distancing over time (d < 0) will increase the daily new infection rate. The parameters γ and d are calibrated to data from a given community at the time when social distancing was put into effect. We extend the meaning of social distancing to include physical isolation, sheltering in place, staying at home, wearing face masks in public, washing hands, and restricting group-gathering size and frequency. If no social distancing is implemented, , and and both the total and daily infections grow exponentially with time until the number of susceptible individuals is depleted, or nearly all people, Pmax, have been infected. But if all the infected people are clearly traced, identified, and completely isolated, d = 1, P(t) = P0 and , there would be no spread at all and, in turn, no epidemic.
Constant social distancing
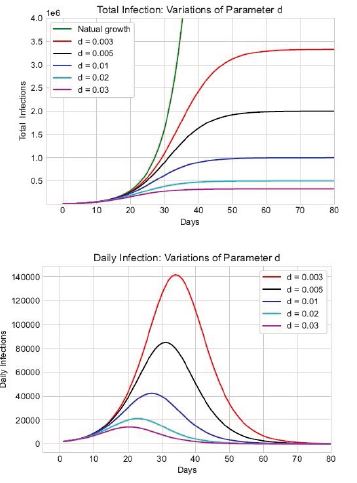
In the absence of vaccines, people’s learning behavior is critical to controlling the spread of COVID-19. Given the community transmission rate γ, the behavior of people will, in principle, determine the outcome of the epidemic, which includes the total number of infections and deaths, time of peak new daily infections, and the time to reach a plateau in the total number of infections and deaths. To illustrate these effects, we take the transmission rate γ 0.17 / day (or the effective reproduction number R0 ~ 1.2 − 2.4 ), as the average transmission rate observed in the United States and assume P0 = 10000 at time t0, when the social distancing is put in place. We also assume the social-distancing level remains constant from time t0 through the epidemic. The total number of infections at a given time and the daily infection rate under various levels of social distancing (d = 0, 0.003, 0.005, 0.01, 0.02, 0.03) can be plotted as a function of time t, as shown in figure 1.
The infection data for the US [21,22,23] show that the social distancing level across the United States around March 22, 2020 ranged from 0.015 (New Jersey) to 0.065 (San Francisco) [6]. Our results show that the number of infections -- both the total number over the course of the epidemic and the daily number of new infections -- are very sensitive to people’s learning behavior and the level of social distancing achieved. Both quantities dramatically increase when social distancing is relaxed, and the date of the peak in daily infections is delayed. This result differs from other studies, which capture the delaying effect of social distancing on the time of peak daily infections but not the effects on the total and daily number of infections [17-20]. Our model clearly shows that reducing social distancing not only increases the length of time until life returns to “normal” but also places more lives at risk.
Figure 1:Total number of infections (top) and daily number of new cases (bottom) versus time as functions of the social distancing parameter d. The red, black, blue, cyan, and purple lines represent increasing social distancing at d = 0.003, 0.005, 0.01, 0.02, and 0.03, respectively. The green solid line in the top figure shows the total infections with no intervention, where γ= 0.17
Relaxed social distancing
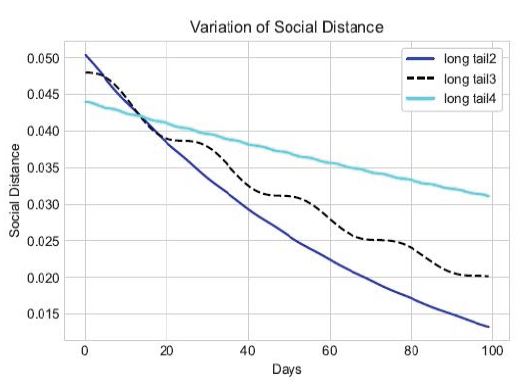
When people’s behavior change during an epidemic, for example, after a period of sheltering in place, various pressures (psychological, economic, etc.) may encourage people to relax their social distancing behavior once the peak of daily infections has passed in their community. Hot weather may result in fewer people wearing face masks. Recent studies show that the combination of using face covers, keeping a physical distance between individuals, and washing hands is the most effective and cost-saving strategy in the battle against COVID-19 [24]. The asymptomatic transmission between two people can be reduced significantly from 100% if no one wears a face mask to ~1.5% if everyone wears a face mask. In both South Korea and Taiwan, businesses were never shut down, but people did wear face masks all the time and in all places. Their infection rates peaked early (March 4 in South Korea and March 22 in Taiwan), and both countries have relatively few new infections. Based on the above information, we can summarize the effect of relaxing social distancing requirements on people in two explicit mathematical expressions: (1) people reducing their wearing of face masks in public and (2) people reducing their distance of close contact and increasing the size and frequency of occasional group gatherings. We assume the social-distancing parameter changes with time as , where the parameter β represents a relaxation rate, i.e., the percentage of people who stop wearing masks each day, and T is a relaxation time representing a time period over which people relax their social behavior, for example, by gathering in groups with less than 6 feet of separation (Figure 2).
Figure 2:The effect of social distancing parameter d changing with time. The blue line represents the fast decline of social distancing with a relaxation time T = 11 days (high proportion of people with no face mask). The black dashed line represents slightly less relaxing of social distancing over a longer relaxation period of 24 days. The cyan line denotes a slightly reduced social distancing but with a relaxation period of 7 days.
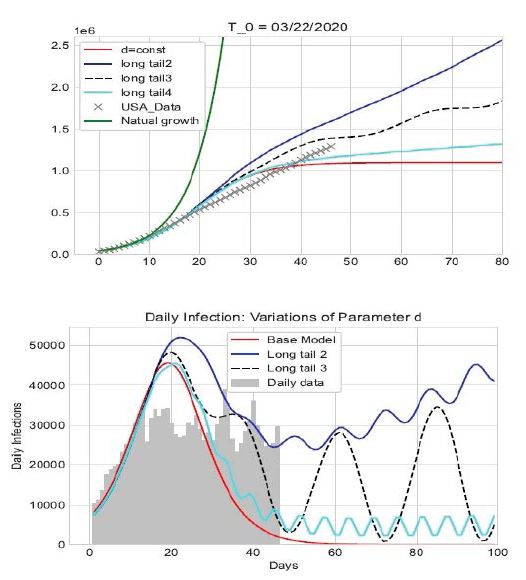
We illustrate the effect of changes in people’s behavior with an example using the average US spread rate γ ~ 0.17 in late March 2020 [6]. We consider four scenarios: (1) the level of social distancing remains constant throughout the epidemic at the level of the week of March 23, 2020, 0 d = d 0.04 , β= k = 0; (2) the level of social distance drops because a large portion of the population does not wear face mask in public and starts gathering in groups every 2 weeks, corresponding to 0.05 and a relaxation rate β 1.35%/ day , k=0.002 and T = 11 days; (3) the level of social distance drops because a modest portion of people do not wear face masks in public spaces and they start gathering every 4 weeks, 0.048, β= 0.9%/day, k = 0.0329, and T = 24 days; and (4) the level of social distance drops because a very small fraction of people do not wear face masks in public and they start gathering weekly, d0 = 0.044, β = 0.35%/day, k = 0.002, and T = 7 days. Figure 3 shows the effects of these changes in social distancing and people’s learning behavior.
Figure 3 shows that the outcome and spread trajectory of COVID-19 is very sensitive to the level of social distancing and people’s behavior. The total number of infections increases with the number of people not wearing face masks in public and decreases with the number of days of people maintaining social distancing. The more people wear face masks in public, the faster the epidemic ends and the lower the number of infections. With fewer people wearing face masks, the epidemic lasts much longer, and the number of daily infections oscillates for a long time (similar to the blue and cyan lines shown in figure 3). The epidemic spread can even grow into a second wave (as shown by the black dashed line in figure 3). When social distance is maintained at a constant level of first implementation, the number of new cases decreases symmetrically about the peak of daily infections, and the epidemic is over within 60 days from t0. This result agrees with the epidemic data reported from South Korea [25, 26], Taiwan [27], Austria and some other countries.
Applications
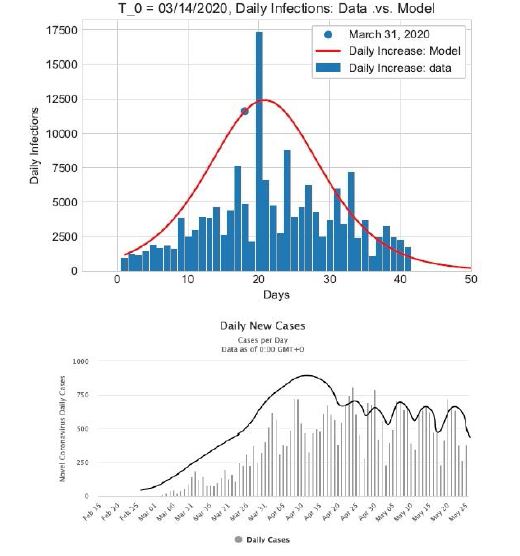
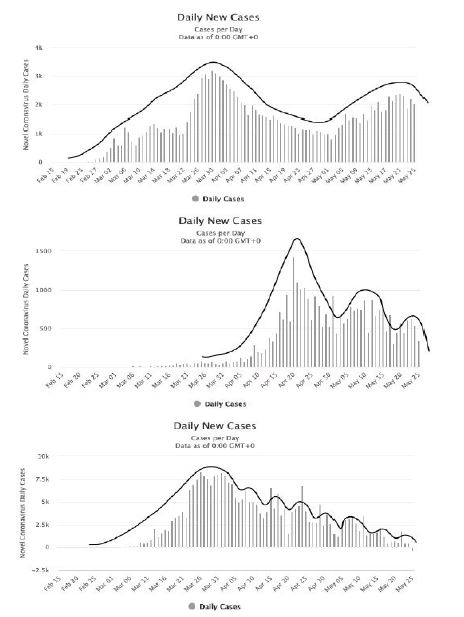
Applying our analysis to a number of pandemic centers worldwide and comparing our results with epidemic data reported by the Johns Hopkins University [21] and www. worldometer.info, we find that the data for countries like Taiwan[27], Japan [28], South Korea [25], France [29], Germany [30], Norway [31], etc. are consistent with a steady social distancing maintained throughout the epidemic (e.g., March 20 to June 7), while the epidemic data for the United States [22], United Kingdom [32], and Sweden [33] constant with our hypothetical scenario (2), in which the number of people wearing face masks in public drops significantly over time. Figure 4 shows the epidemic data from France and Sweden. The epidemic trajectory of Iran [34] matches scenario (3), reflecting with a longer relaxation time, while Singapore [35] and many European countries, such as Spain [36], Italy [37], Denmark [38], Finland [39], etc., are consistent with scenario (4). Figure 5 shows the data from Iran, Singapore, and Spain.
Figure 3:Total number of infections (top) and number of daily new cases (bottom) changing over time under four social-distancing scenarios. The red line represents the spread trajectory under constant social distancing at the level when restrictions were put in place. The blue line corresponds to social distancing decreasing at a relaxation rate β= 1:35%/day and relaxation time of 11 days. The black dashed line corresponds to 0:9%/day and 24 days. The cyan line corresponds to 0:35%/day and T = 7 days. All cases assume a community spread rate of γ= 0:17.
Figure 4:Number of daily new infections as a function of time for France (top) and Sweden (bottom). The red line in the top plot is the daily infections from our model with constant social distancing d from the week of March 20, 2020. The line in the bottom plot is the envelope of the data (not from our model). When compared to the blue curve in figure 3, the shape of data indicates periodically relaxed social distancing during the epidemic and a notable relaxation rate of people wearing face masks in public areas.
Figure 5:Number of daily new infections as a function of time for Iran (top), Singapore (middle), and Spain (bottom). The line in each figure is the envelope of the data (not from our model). The epidemic trajectory in Iran suggests that a longer relaxation time is occurring, while the trajectories for Singapore and Spain suggest that most people are wearing masks but the relaxation time is shorter, consistent with more frequent group gatherings.
Our analysis shows that social distancing and changes in people’s behavior can significantly affect the cumulative and daily number of infections and, accordingly, the number of deaths over the course of a pandemic. Good social distancing includes (a) wearing face masks in public spaces, (b) not gathering in groups over a certain size, (c) washing hands frequently, and (d) always keeping minimal 6 feet from the others. When people follow these practices, communities will be able to reopen their economies sooner and minimize the number of infections in the absence of a vaccine.
Conclusion
Strict social distancing and people’s learning behavior play significant roles in reducing the spread of the novel coronavirus during this pandemic. Without social distancing, the spread of COVID-19 would grow exponentially with time until most people (~70% of the population) are infected. Social distancing and changes in people’s behavior (isolation, wearing masks in public spaces, restrictions on group gathering size, washing hands, etc) will significantly reduce the virus spread rate and, in turn, determine the final outcome and total infections of the COVID-19 pandemic.
We have demonstrated the dependence and sensitivity of the number of total and daily infections on social distancing under four different scenarios (1) social distancing remains same throughout the epidemic; (2) social distancing drops with time due to a large portion of the population not wearing face masks in the public space and gathering in groups every two weeks; (3) social distancing decreases with time due to a modest portion of people not wearing face masks in the public space and gathering every four weeks; and (4) social distancing lowers with time due to a very small fraction of people not wearing face masks in the public area but gathering every week. Our results show that strict social distancing and improved people behavior not only slow down the virus spread rate but also significantly reduce the number of the total infections, daily infection rates, peak of daily infections, and the duration of the epidemic as a whole.
Under strict social distancing, the rise and fall of the epidemic spread are nearly symmetric to the peak of daily infections and the entire duration of the epidemic would be less than 60 days. If everyone wears a face mask in the public space, there would not be a need to shut down the economy even if there are second and third pandemic waves of COVID-19. Relaxed social distancing will result in many more infections and deaths. These research results have immediate applications in the implementation of various social distancing policies and general significance for ongoing outbreaks and similar infectious disease epidemic in the future.
Declaration of Interests
We declare no competing interests.
Data Sharing
The data that support the findings of this study are openly available in https://www.worldometers.info/coronavirus/ countries.
Acknowledgement
The authors are grateful to Dr. Arick Wang for many valuable discussions, Dr. Paul A Bradley for valuable comments, and Dr. Hang Zhou for the data of US states and valuable discussions. The authors are grateful to CS Carmer for editing this article. B.C. was supported under the auspices of the U.S. Department of Energy by the Los Alamos National Laboratory under Contract No.89233218CNA000001.
WHO (2020) Novel coronavirus (2019-nCoV) situation report - 11. [ Ref ]
WHO (2020) Coronavirus disease 2019 (COVID-19) situation report - 51. [ Ref ]
Chan JF, Yuan S, Kok KH, Kai-Wang K, Chu H, et al. (2020) A familial cluster of pneumonia associated with the 2019 novel coronavirus indicating person-to-person transmission: a study of a family cluster. Lancet 395: 514-523. [ Ref ]
CDC (2019) 2019 Novel coronavirus (2019-nCoV). [ Ref ]
Li R, Pei S, Chen B, Song Y, Zhang T, et al. (2020) Substantial undocumented infection facilitates the rapid dissemination of novel coron- avirus (SARS-CoV2). Science. [ Ref ]
Cheng B, Wang YM (2020) A fundamental model and predictions for the spread of the COVID-19 epidemic. medRxiv. [ Ref ]
IHME COVID-19 health service utilization forecasting team (2020) Forecasting COVID-19 impact on hospital bed- days, ICU-days, ventilator days and deaths by US state in the next 4 months. medRxiv. [ Ref ]
Kissler S, Tedijanto C, Lipsitch M, Grad OH (2020) Social distancing strategies for curbing the COVID-19 epidemic. medrxiv. [ Ref ]
Ferguson NM, Laydon D, Nedjati-Gilani G, Imai N, Ainslie K, et al. (2020) Impact of non-pharmaceutical interventions (NPIs) to reduce COVID19 mortality and healthcare demand. Imperial College COVID-19 Response Team Report. [ Ref ]
Maier BF, Brockmann D (2020) Effective containment explains subexponential growth in recent con- firmed COVID-19 cases in China, Science. [ Ref ]
Lourenco J, Paton R, Ghafari M, Kraemer M, Thomp- son C, et al. (2020) Fundamental principles of epidemic spread highlight the immedi- ate need for large-scale serological survey to assess the stage of the SARSCoV- 2 epidemic, medRxiv. [ Ref ]
Enserink M, Kupferschmidt K (2020) Mathematics of life and death: How disease models shape national shutdowns and other pandemic policies. Science. [ Ref ]
Einian M, Tabarrae HR (2020) Modeling of COVID-19 Pandemic and Scenarios for Containment. medrxiv. [ Ref ]
Nikolaou M (2020) A Fundamental Inconsistency in the SIR Model Structure and Proposed Remedies. medrxiv. [ Ref ]
Tsallis C, Tirnakli U (2020) Predicting COVID-19 peaks around the world. medrxiv. [ Ref ]
Narayanan CS (2020) Modeling the COVID-19 outbreak in the United States. medrxiv. [ Ref ]
Matrajt L, Leung T (2020) Evaluating the effectiveness of social distancing interventions against COVID-19. medrxiv. [ Ref ]
Cano OB, Morales SC, Bendtsen C (2020) COVID-19 Modelling: the Effects of Social Distancing. medrxiv. [ Ref ]
Dreher N, Spiera Z, McAuley FM, Kuohn L, Durbin JR, et al. (2020) Impact of policy interventions and social distancing on SARS- CoV-2 transmission in the United States. medrxiv. [ Ref ]
Eng G (2020) Initial Model for Impact of Social Distancing on CoVID-19 Spread. medrxiv. [ Ref ]
John Hopkins University Coronavirus Resource Center [ Ref ]
Wikipedia (2020) 2020 coronavirus pandemic in the United States. [ Ref ]
USA https://www.worldometers. info/coronavirus/country/us/ [ Ref ]
Zhang R, Li Y, Zhang AL, Wang Y, Molina MJ (2020 ) Identifying airborne transmission as the dominant route for the spread of COVID-19. Proceedings of National Academy Science. [ Ref ]
Wikipedia (2020) 2020 coronavirus pandemic in South Korea. [ Ref ]
South Korea https: //www.worldometers.info/coronavirus/country/ south-korea/ [ Ref ]
Taiwan https://www. worldometers.info/coronavirus/country/taiwan/ [ Ref ]
Japan https://www.worldometers. info/coronavirus/country/japan/ [ Ref ]
France https://www. worldometers.info/coronavirus/country/france/ [ Ref ]
Germany https://www. worldometers.info/coronavirus/country/ germany/ [ Ref ]
Norway https://www. worldometers.info/coronavirus/ country/norway/ [ Ref ]
United Kingdom https://www. worldometers.info/coronavirus/ country/uk/ [ Ref ]
Sweden https://www. worldometers.info/coronavirus/country/sweden/ [ Ref ]
Iran https://www.worldometers. info/coronavirus/country/iran/ [ Ref ]
Singapore https://www. worldometers.info/coronavirus/country/ singapore/ [ Ref ]
Spain https://www.worldometers. info/coronavirus/country/spain/ [ Ref ]
Italy https://www.worldometers. info/coronavirus/country/italy/ [ Ref ]
Denmark https://www.worldometers.info/coronavirus/country/danmark/ [ Ref ]
Finland https://www.worldometers.info/coronavirus/country/finland/ [ Ref ]
