Journal Name: Journal of Health Science and Development
Article Type: Theoretical Literature
Received date: 20 August, 2020
Accepted date: 29 September, 2020
Published date: 2021-01-30
Citation: Kosinski RJ (2020) The Influence of the Duration of Immunity on a COVID-19 Epidemic: A Simulation Study. J Health Sci Dev Vol: 3, Issu: 2 (10-13).
Copyright: © 2020 Kosinski RJ. This is an open-access article distributed under the terms of the Creative Commons Attribution License, which permits unrestricted use, distribution, and reproduction in any medium, provided the original author and source are credited.
Abstract
A series of spreadsheet simulations using SEIS, SEIR, and SEIRS models showed that different durations of effective immunity could have important consequences for the prevalence of an epidemic disease with COVID-19 characteristics. Immunity that lasted three months, six months, one year, and two years was tested with pathogen R0 values of 1.5, 2.3, 3.0, and 4.0. Immunity that lasted from three months to two years produced recurrent disease outbreaks triggered by the expiration of immunity. If immunity waned gradually instead of persisting at full effectiveness to the end of the immune period, the recurrent outbreaks became more frequent. The number of times an average individual became infected during the epidemic was markedly higher when the duration of immunity was shorter. The duration of effective immunity is vital for predicting the epidemiology of a disease like COVID-19.
Keywords:
COVID-19, Epidemic, Epidemiology, Model, Immunity.
Introduction
The ability of the immune system to protect a person recovering from COVID-19 from further infection is an important question in management of the COVID-19 pandemic. The majority of infected individuals do clear the SARS-CoV-2 virus from their bodies, and do create antibodies and T-cells against the virus (reviewed in Huang et al. and in Prompetchara et al.), but how long this response remains protective is unclear [1,2]. The duration of immunity to SARS-CoV-2 is also of great importance for the practicality of a vaccine.
In past epidemics, the duration of immunity has not often been directly determined, but it is still regarded as a key variable, especially for the effectiveness of vaccines. Mathews et al. concluded that waves of infection in the 1918-1919 influenza pandemic swept across England partly because antigenic drift and waning of immunity caused 33-65% of recovered victims to lose immunity between waves [3]. Ray et al. found that the effectiveness of influenza vaccines at preventing infection declined measurably over a period of weeks [4]. Kucharski et al. modeled the process by which a lifetime of infections with different influenza A strains builds an individual’s ability to respond to future strains [5]. They found that cross-reactivity between strains decayed rapidly (half-life of 2.4 years). In the 2009 H1N1 influenza pandemic, Tunheim et al. reported that vaccinated and unvaccinated pregnant women in Norway suffered a similar decline in antibody titers after the disease or vaccination, with the titer half-life being approximately 200 days [6].
Turning to COVID-19, Kissler et al. did a simulation study that explored the duration of immunity plus several other variables such as the strength of social distancing, cross-immunity to betacoronaviruses, and seasonal changes in the basic reproduction number (R0) to simulate the “postpandemic period” for COVID-19 [7]. They found that shorter duration of immunity (about 40 weeks) tended to trigger annual outbreaks, but longer durations (up to two years) produced biennial outbreaks. They found that if immunity was permanent, the disease could disappear after its initial outbreak. These findings were influenced by the fact that Kissler et al. increased R0 in the fall and decreased it in the spring of each simulated year to model seasonal effects common in flu epidemics [7]. Britton et al. did extensive simulations of a COVID-19-like disease in order to determine the effect of population heterogeneity on the development of herd immunity, but in their models, immunity was assumed to last “for an extended period of time,” longer than the events they simulated [8]. Saad- Roy et al. simulated a more complex “immune landscape” in which different levels and durations of immunity could result from primary infection, secondary infection, and vaccination. They found that variations in immunity and NPIs (nonpharmaceutical interventions such as social distancing) could result in dramatically different epidemic outcomes [9]. They emphasized that the immune response to SARS-CoV-2 is a vital area of study. Papachristodoulou et al. suggested that immunity to the COVID pathogen may be so weak and of such short duration that herd immunity may be impossible, and they called for urgent research on the immune response to COVID-19 [10].
Radanliev et al. proposed an ambitious system of “predictive, preventive and personalized pandemic management strategies” and surveillance to combat pandemics [11]. Given the literature above, it seems clear that the duration of immunity to SARS-CoV-2 should be an important datum in this matrix.
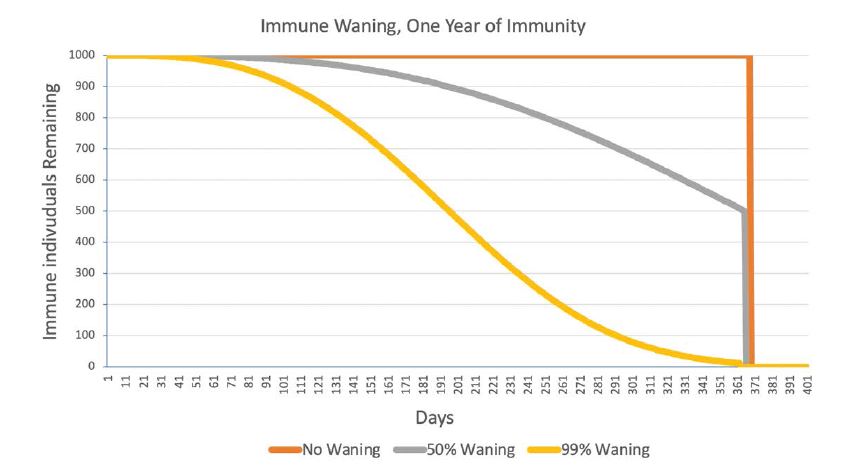
Figure 1:The size of a cohort of 1,000 newly-immune individuals under three conditions of immune “waning.” “50% Waning” means that half the immune individuals lose their immunity before their one year of immunity ended. At one year, all the remaining immune individuals become susceptible again.
This report explores the effects of the duration of immunity in a constant, non-seasonal environment. It uses simulation to determine the effect of immune responses that are protective for time periods ranging from three months to two years after the conclusion of the infective period.
Methods--The Model
The simulations were SEIS, SEIR, and SEIRS models done using difference equations on an Excel spreadsheet. The iteration interval (each line and column on the spreadsheet) was one day. The most complex model (SEIRS) contained four different groups of individuals in a model population of 1000: susceptible, exposed (infected but not yet infective), infective, and immune, with the following durations: Susceptible → Exposed (5 days) → Infective (5 days) → Immune (90-728 days) → Susceptible
Each exposed, infective, and immune individual moved one day at a time through its compartment. For example, an exposed individual was moved from day one of exposure to day two, then to day three, etc. In the SEIS model, an infective individual cycled back to the susceptible group when its time in the infective group finished; in the SEIR model, it permanently entered the immune group when the infection was over; in the SEIRS model, it cycled back to susceptible when its time in the immune group had expired.
Some simulations departed from this chronological progression by employing “immune waning.” In waning, some immune individuals left the immune compartment and returned to the susceptible compartment early. This caused the number of immune individuals to slowly decrease over time rather than lasting undiminished to the end of the immune period. Waning affected just the number of immune individuals, not the strength of immunity of those remaining in the immune compartment. Waning is illustrated in figure 1 for a cohort of 1000 newly-immune individuals with a maximum duration of immunity of one year.
Although “Exposed” and “Infective” groups were handled separately in the calculations, they were lumped into one group called “Infected” in the graphs that follow.
The model included no death, birth, vaccine, or seasonal change. The simulations started when one individual at the very beginning of its five-day infective career entered the population of 999 susceptible individuals.
The number of new infections generated per infective per day on day t was defined by it = (R0/5)*[St/(St + It + Rt)]
where, St, It, and Rt are the numbers of susceptible, infected, and immune hosts and the “5” refers to the 5-day length of the infective period.
All simulations were done with four values of the basic reproduction number (R0): 4.0, 3.0, 2.3, and 1.5.
Results
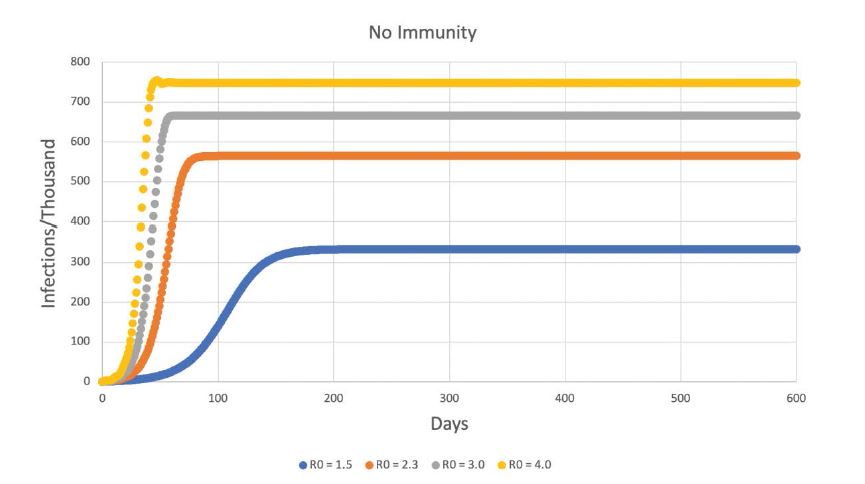
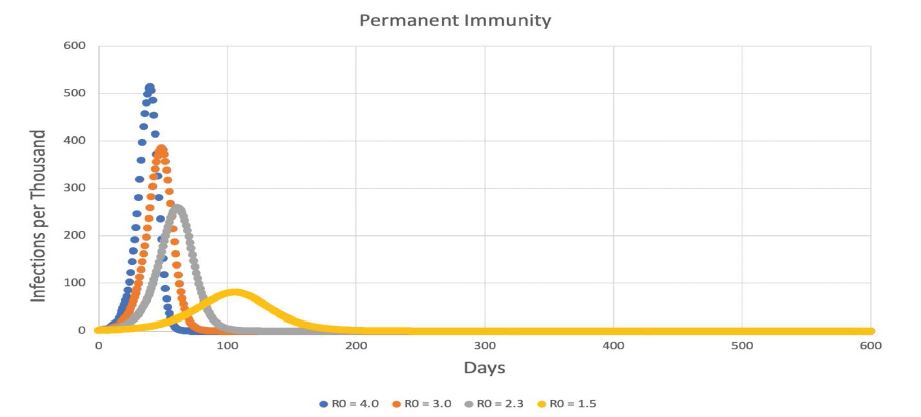
The results are shown in figures 2-8 below, which extend from no immunity, through immunity of increasing duration, to permanent immunity in figure 8. Figures 2-8 do not include any immune waning. Every immune organism experienced its full duration of immunity.
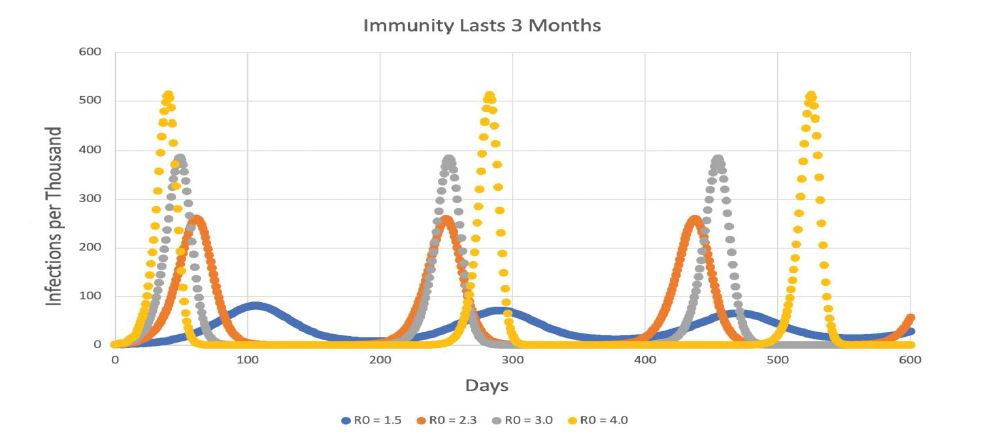
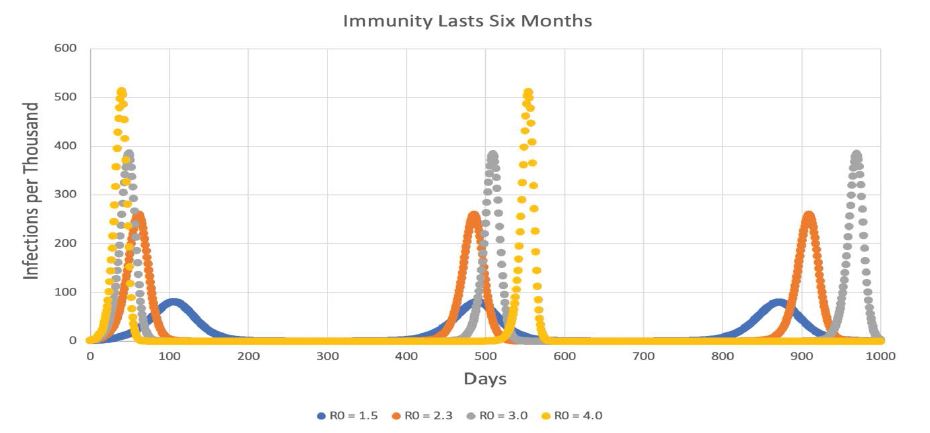
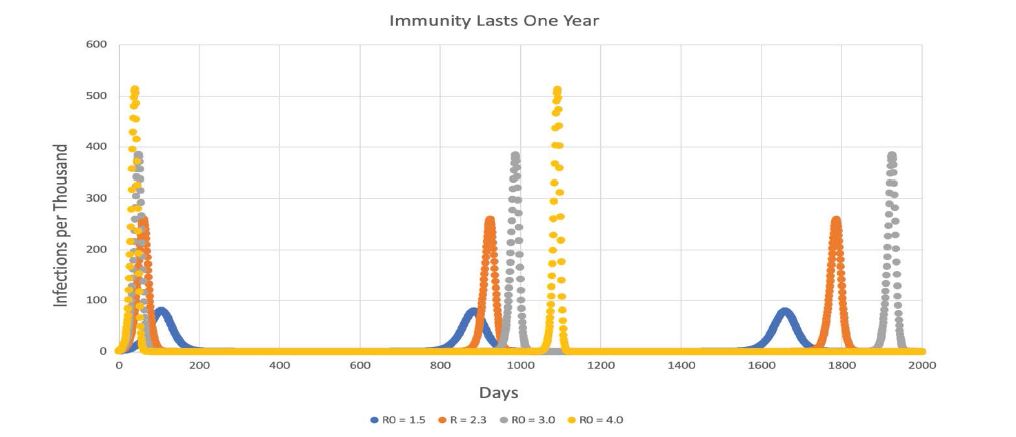
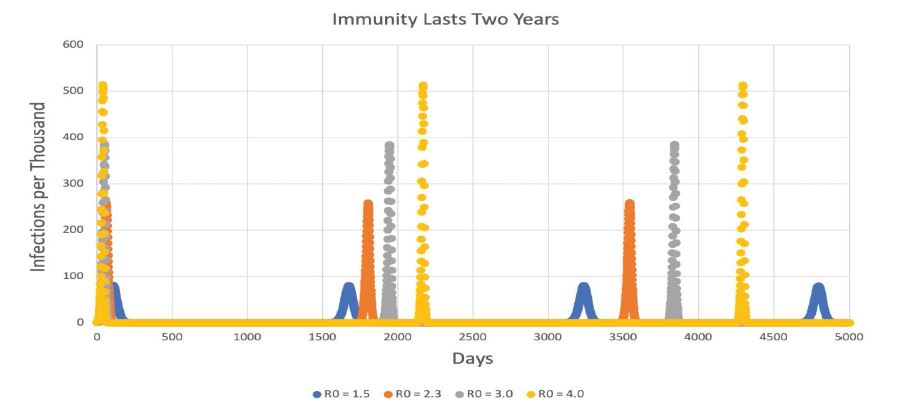
Figures 3-7 show that long periods of immunity (but not permanent immunity) lead to outbreaks of disease at long intervals. This pattern is retained when immune waning is in effect, but the more complete the waning is, the more frequent the outbreaks become (Table 1).
However, despite the more frequent outbreaks with greater immune waning, the peak number of individuals infected in each outbreak was virtually the same as when there was no waning.
Figure 2:The size of a cohort of 1,000 newly-immune individuals under three conditions of immune “waning.” “50% Waning” means that half the immune individuals lose their immunity before their one year of immunity ended. At one year, all the remaining immune individuals become susceptible again.
For simulations without immune waning, the time between peaks is 2.35-2.40 times the duration of immunity (e.g., 863 days for immunity that lasts 364 days).
One final effect of the duration of immunity relates to the number of cases of COVID-19 that the population experiences per capita. If there is no vaccine, shorter durations of immunity mean more peaks per time interval, a greater risk of catching the disease, greater economic harm due to lockdowns and absenteeism, etc. Because immune waning decreases the time between peaks, waning also results in less effective immunity and more cases per capita. Using an R0 of 2.3 and a uniform simulation length of 2000 days (5.48 years), table 2 shows that the number of cases per capita over 2000 days can vary from 18.481 to 1.741, depending on duration of immunity and degree of waning.
Since almost all the cases occur during peaks, if 2000 days includes the same number of peaks as a shorter duration of immunity, the per capita case rate will be almost the same for the two durations.
Finally, as might be expected, a higher R0 also gives a higher per capita case rate (Table 3), with longer durations of immunity leading to fewer infections for each R0.
Discussion
This research produced both expected and unexpected results about the duration of immunity to a COVID-like disease.
On the expected results, figures 2 and 8 show that the SEIS and SEIR models as implemented on the spreadsheet produced the classic, anticipated results. Also, use of a higher R0 in the SEIRS models produced higher peaks, and more sweeping fluctuations that resisted settling down to an equilibrium value. For example, contrast the different R0 curves in figure 3.
Figure 3:SEIRS model with 3 months of immunity.
Figure 4:SEIRS model with 6 months of immunity. X-axis extends to 1000 days.
Figure 5:SEIRS model with one year of immunity. Note that the x-axis extends out to 2000 days (more than five years).
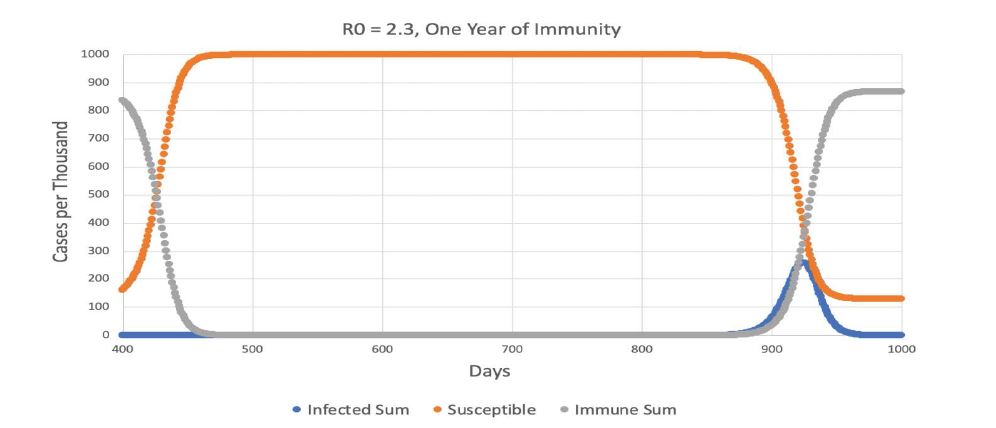
Figure 6:The portion of figure 5 from 400-1000 days using R0 = 2.3. Note how the decline in immune hosts due to the ending of their one year of immunity (gray) produces an increase in susceptible hosts (orange), and this in turn causes an increase in infected hosts (blue) after a lag of more than a year.
Figure 7:SEIRS model with 2 years of immunity. X-axis extends to 5000 days (almost 14 years).
Figure 8:SEIRS model with 2 years of immunity. X-axis extends to 5000 days (almost 14 years).
Table 1:Time (in days) between outbreak peaks for 0%, 50%, and 99% immune waning for immune periods of various durations R0 = 2.3 in all cases.
| Duration | No Waning | 50% Waning | 99% Waning |
|---|---|---|---|
| 3 Months | 188.0 | 152.0 | 99.0 |
| 6 Months | 424.3 | 326.2 | 193.0 |
| 1 Year | 863.0 | 646.7 | 387.8 |
| 2 Years | 1740.5 | 1295.7 | 766.2 |
Table 2:Number of COVID-19 cases per capita in a 2000-day simulation R0 = 2.3.
| Duration | No Waning | 50% Waning | 99% Waning |
|---|---|---|---|
| 3 Months | 8.709 | 10.610 | 18.481 |
| 6 Months | 4.353 | 5.230 | 8.763 |
| 1 Year | 2.612 | 2.613 | 4.354 |
| 2 Years | 1.741 | 1.741 | 2.612 |
Table 3:Number of COVID-19 cases per capita in a 2000-day simulation, without waning.
| Duration | R0 = 1.5 | R0 = 2.3 | R0 = 3.0 |
|---|---|---|---|
| 3 Months | 6.051 | 8.709 | 8.538 |
| 6 Months | 2.936 | 4.353 | 4.743 |
| 1 Year | 1.760 | 2.612 | 2.843 |
| 2 Years | 1.173 | 1.741 | 1.845 |
The most unexpected outcome is that even relatively short periods of immunity could produce persistent oscillations. Consider figure 3 again. Immunity lasting three months produced repeated outbreaks about every 240 days for R0 = 4.0 and 185 days for R0 = 1.5. The lower R0 was, the lower the peaks were, but sequential peaks for the same R0 were almost identical in size. The same pattern of nearly-identical peaks at long intervals is seen in figure 4, 5, and 7. The effect of increasing the duration of immunity is to make the interval between the peaks longer. As pointed out in table 1, when no immune waning is in effect, the peaks seem to be separated by an interval that is about 2.4 times the duration of immunity for an R0 of 2.3. As R0 rises, the interpeak interval gets longer, but the overall pattern is the same.
These strong, renewed outbreaks after immunity “times out” seem to be a robust feature of the model.
Figure 6 explains the timing of the outbreaks for one year of immunity. At the left side of the figure, immunity (the gray curve) is rapidly declining, and the susceptibles are going up as a result. By 500 days, 999.97 of 1000 organisms are susceptible and 0.03 are immune. Infected organisms are at a very low level. But infected hosts slowly increase over the next year, reaching 1.0 infected organism on day 860. From this point, the number of infections increases explosively. It appears that the interval between outbreaks is mainly established by how low the number of infected organisms goes after the previous peak. The results of the immune waning simulations reinforce this conclusion.
“Immune waning,” in which immunity gradually fades away rather than persisting undiminished to the end of the immune period, does not change the height of the peaks, but it does make the outbreaks more frequent. The interpeak interval is mainly established by the ability of infected individuals to recover from very low numbers. When waning is occurring, early release of immune individuals to the susceptible population keeps the infected population higher than it would be without waning. For example, in the simulations in which immunity lasted a year, the low point of the infected individuals between the first two peaks was 3.6 x 10⁻²⁰ when there was no immune waning, but it was 5.3 x 10⁻¹¹ with 50% waning and 6.7 x 10⁻⁵ with 99% waning. With higher numbers of infected individuals between peaks, recovery will be faster and the peaks will be closer together. Immunity where 99% of the individuals revert to susceptible before the immune period is finished can cut the interpeak time interval by more than half.
The very low number of infected individuals between the peaks raises the question of stochastic extinction of the pathogen, but this deterministic model that did not include that outcome. Also, because the exact timing of peaks depends on the low point of infected organisms, this timing could be heavily influenced by stochastic factors such as input of small numbers of infected individuals and variations in the degree of immune waning.
Cases per individual are a basic indicator of the harm the epidemic is doing. Tables 2 and 3 make clear that for simulations of equal length, the number of times an average individual contracts the disease responds strongly to the duration of immunity. Short durations of immunity result in many peaks within a 2000-day period, and each peak generates many new cases of disease. Immune waning also shortens the time interval between peaks and results in more cases. Both a short duration of immunity and a high degree of immune waning will also make a vaccine less practical. A high R0 also increases the case rate, but this effect does not seem to be as powerful as the duration of immunity. Therefore, if we want an epidemic that will do the least harm, we would desire one with a long period of immunity, low immune waning, and a low R0.
To summarize, while these simulations omit much realworld complexity, they make it clear that the duration of immunity, by itself, can have an important influence on the course of the an epidemic. Shorter durations of immunity are not effective in ending the epidemic, but cause oscillations in disease prevalence and increase the average case rate. Longer periods of immunity can successfully suppress the disease for long periods and lower the case rate, but are characterized by repeated outbreaks triggered by the expiration of immunity. Gradual waning of immunity increases the number of susceptibles and can markedly reduce the time period between outbreaks of the infection.
The duration of effective immunity is a key variable in the control of a COVID-19 epidemic.
Huang AT, Garcia-Carreras B, Hitchings MDT, Yang B, Katzelnick L, et al. (2020) A systematic review of antibody mediated immunity to coronaviruses: antibody kinetics, correlates of protection, and association of antibody responses with severity of disease. medRxiv. [ Ref ]
Prompetchara E, Ketloy C, Palaga T (2020) Immune responses in COVID-19 and potential vaccines: Lessons learned from SARS and MERS epidemic. Asian Pacific Journal of Allergy and Immunology 38: 1-9. [ Ref ]
Mathews JD, McBryde ES, McVernon J, Pallaghy PK, McCaw JM (2010) Prior immunity helps to explain wave-like behaviour of pandemic influenza in 1918-9. BMC Infect Dis 10:128. [ Ref ]
Ray GT, Lewis N, Klein NP, Daley MF, Wang SV, et al. (2018) Intraseason waning of influenza vaccine effectiveness. Clinical Infectious Diseases 68: 1623-1630. [ Ref ]
Kucharski AJ, Lessler J, Read JM, Zhu H, Jiang CQ, et al. (2015) Estimating the life course of influenza A(H3N2) antibody responses from crosssectional data. PLoS Biol 13: e1002082. [ Ref ]
Tunheim G, Laake I, Robertson A, Waalen K, Hungnes O, et al. (2019) Antibody levels in a cohort of pregnant women after the 2009 influenza A(H1N1) pandemic: Waning and association with self-reported severity and duration of illness. Influenza and Other Respiratory Viruses 13: 191- 200. [ Ref ]
Kissler SM, Tedijanto C, Goldstein E, Grad YH, Lipsitch M (2020) Projecting the transmission dynamics of SARS-CoV-2 through the postpandemic period. Science 368: 860-868. [ Ref ]
Britton T, Ball F, Trapman P (2020) A mathematical model reveals the influence of population heterogeneity on herd immunity to SARS-CoV-2. Science 369: 846-849. [ Ref ]
Saad-Roy CM, Wagner CE, Baker RE, Morris SE, Farraret J, et al. (2020) Immune life history, vaccination, and the dynamics of SARS-CoV-2 over the next 5 years. Science 2020: eabd7343. [ Ref ]
Papachristodoulou E, Kakoullis L, Parperis K, Panos G (2020) Long-term and herd immunity against SARS-CoV-2: Implications from current and past knowledge. Pathogens and Disease 78: ftaa025. [ Ref ]
Radanliev P, De Roure D, Walton R, Van Kleek M, Montalvo RM, et al (2020) COVID-19 what have we learned? The rise of social machines and connected devices in pandemic management following the concepts of predictive, preventive and personalized medicine. EPMA Journal 11: 311-332. [ Ref ]
